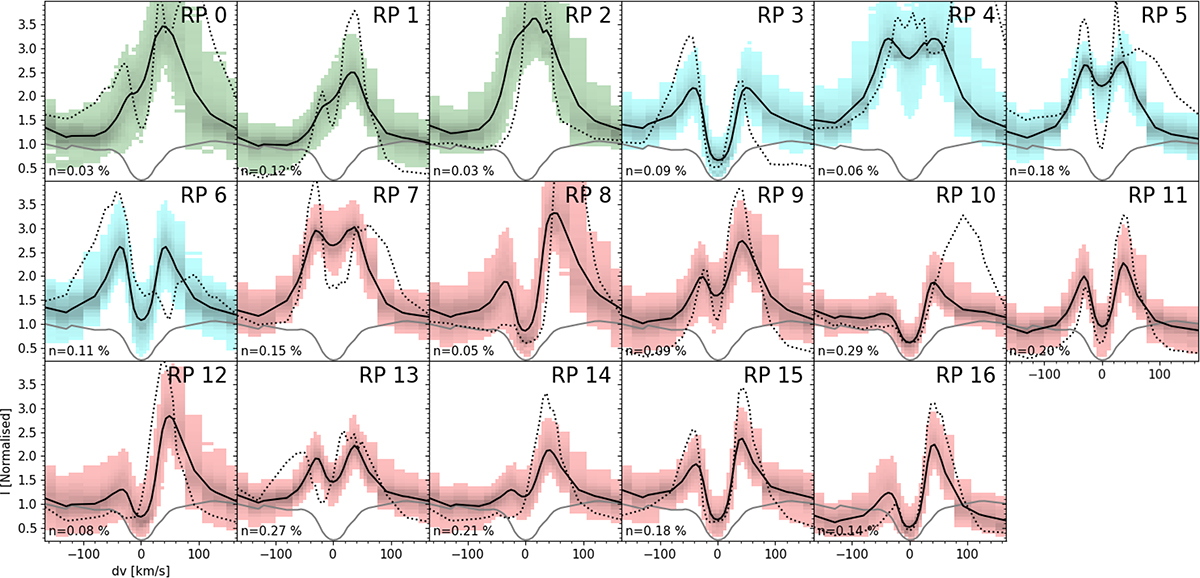
Fig. 6.
Download original image
Hβ spectral profiles associated with riblets from k-means clustering of the F1 flare. Solid black lines show the RPs with the identity labelled in the upper right corner, and the coloured background shows the density distribution of all the clustered profiles. Denser distribution is shown in a darker colour. The dotted black line is the profile furthest away from the RP in Euclidean distance. For reference, the solid grey line is the average profile from a QS region. All profiles are normalised by the far blue wing of the average QS profile. The green distributions are associated with apparent single-peaked RPs, cyan distributions are associated with double-peaked and near-symmetric RPs, and the red distributions are associated with double-peaked RPs with a stronger red peak. The parameter n in all panels represents the fraction of each cluster to the total number of pixels in all timeframes used for clustering. The total number of masked pixels used for clustering was ∼7.8 × 10⁶.
Current usage metrics show cumulative count of Article Views (full-text article views including HTML views, PDF and ePub downloads, according to the available data) and Abstracts Views on Vision4Press platform.
Data correspond to usage on the plateform after 2015. The current usage metrics is available 48-96 hours after online publication and is updated daily on week days.
Initial download of the metrics may take a while.