Fig. 9.
Download original image
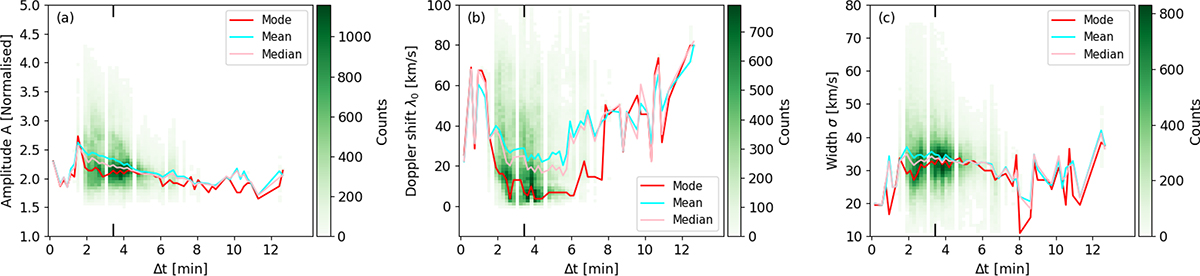
F3 riblet evolution of the parameters obtained from the profiles fitted to a single Gaussian curve. The distributions show the fitted amplitude, Doppler shifts, and broadening from (a)–(c), respectively. In all panels, the green background represents the distribution with respect to time. The mode, mean, and median of each distribution per timestep are shown as red, cyan, and pink curves, respectively. The white columns represent frames that were disregarded due to worse seeing. Bins with a contribution less than 1/100 of the maximum bin are coloured in white. The two short vertical black lines at Δt = 3.4 min mark the timestep with the highest number of pixels identified as riblets. The distribution of the fitted parameters of this timestep is shown in Fig. 10.
Current usage metrics show cumulative count of Article Views (full-text article views including HTML views, PDF and ePub downloads, according to the available data) and Abstracts Views on Vision4Press platform.
Data correspond to usage on the plateform after 2015. The current usage metrics is available 48-96 hours after online publication and is updated daily on week days.
Initial download of the metrics may take a while.