Fig. A.1
Download original image
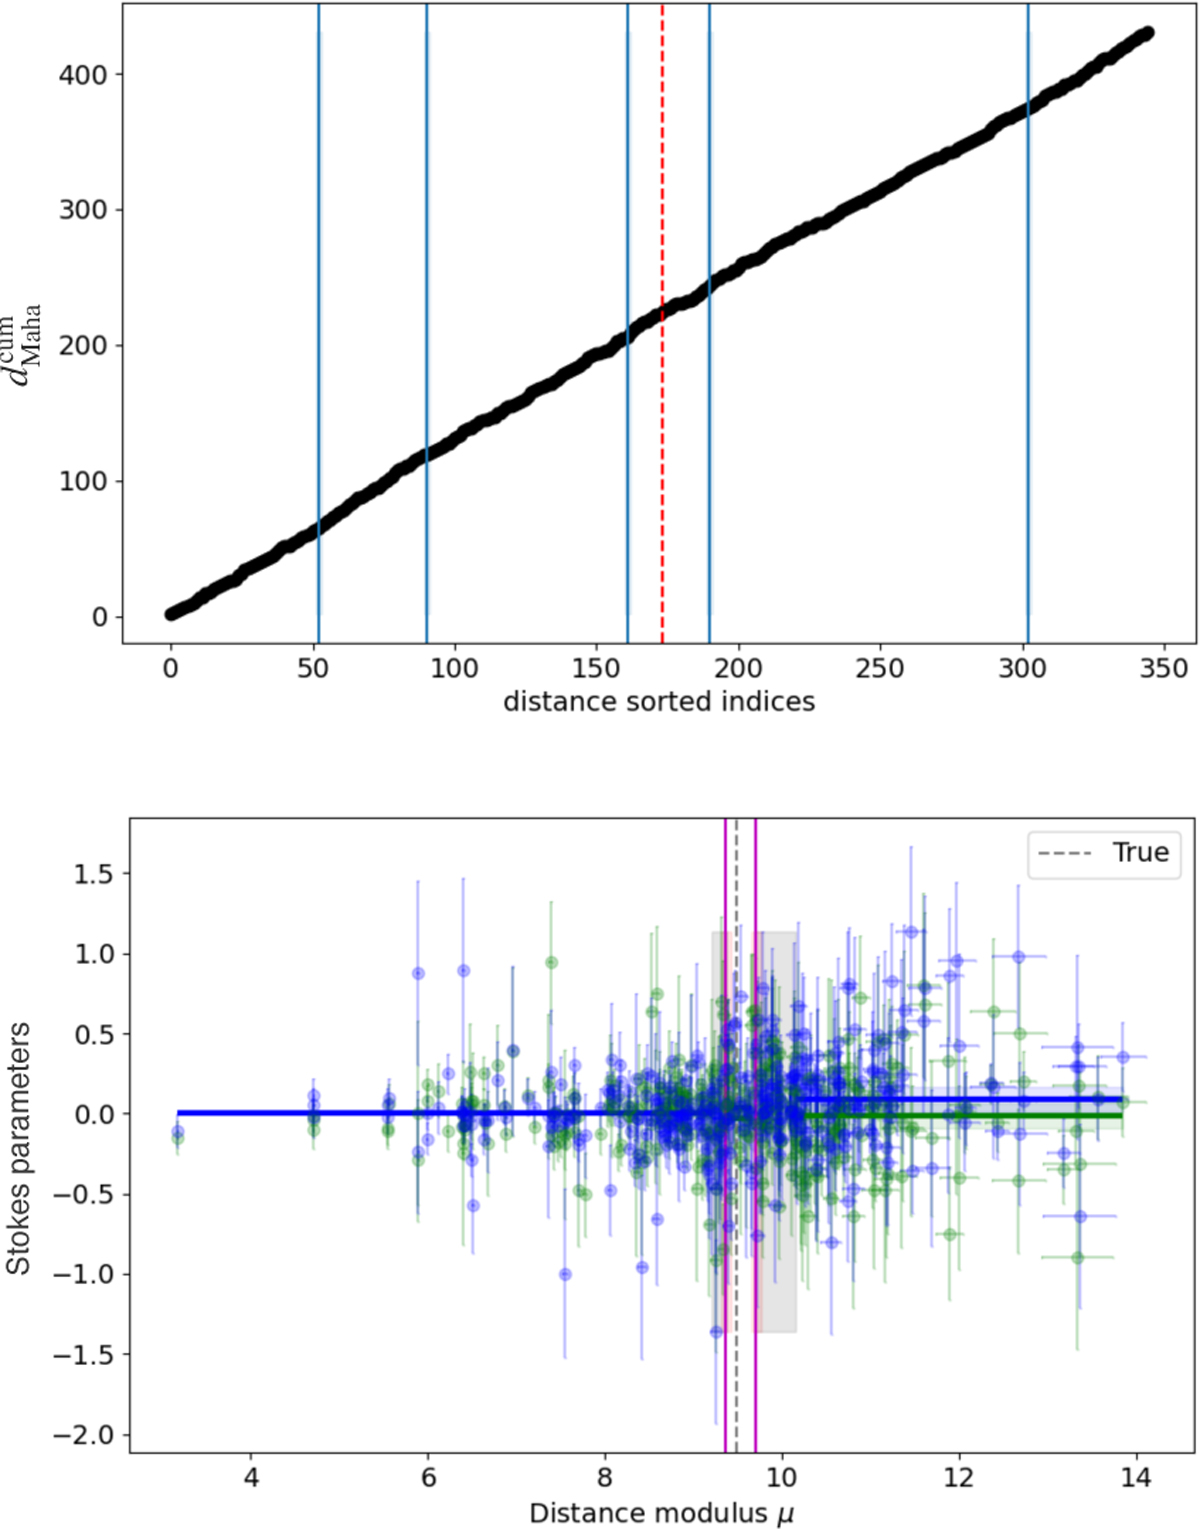
Example of a flagged reconstruction case. Top panel: Breakpoints (vertical blue lines) identified by the strucchange package in the distance-sorted cumulative Mahalanobis distance profile. Bottom panel: LOS decomposition in the qu-μ plane (q in green, while u in blue). The dashed red line in the top panel and the dashed gray line in the bottom panel indicate the true location of the input dust layer.
Current usage metrics show cumulative count of Article Views (full-text article views including HTML views, PDF and ePub downloads, according to the available data) and Abstracts Views on Vision4Press platform.
Data correspond to usage on the plateform after 2015. The current usage metrics is available 48-96 hours after online publication and is updated daily on week days.
Initial download of the metrics may take a while.