Fig. 2
Download original image
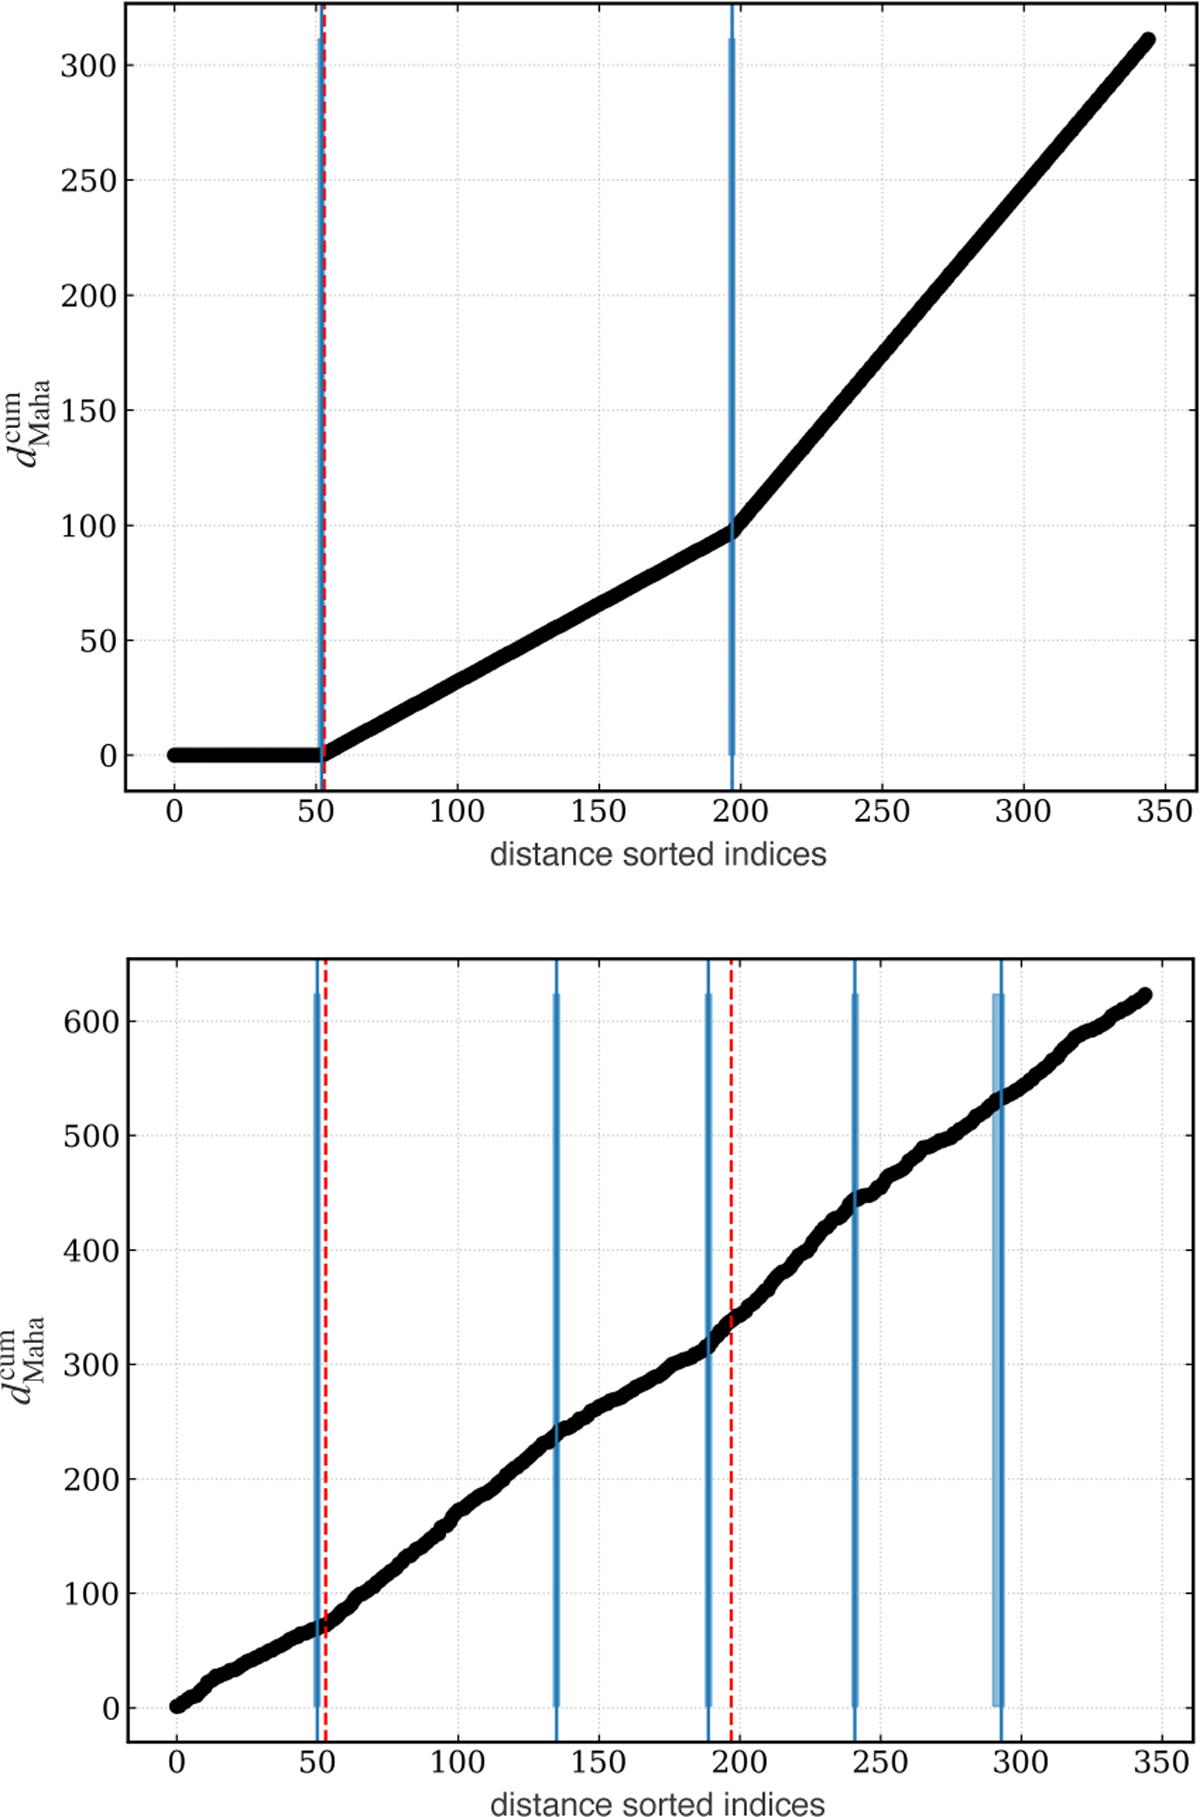
Breakpoints (blue lines) detected in the distance-sorted cumulative Mahalanobis distance profiles using the R strucchange package. Top panel: results for mock data shown in the bottom-left panel of Fig. 1. Bottom panel: results for the mock data shown in the bottom-right panel of Fig. 1. The vertical dashed red lines indicate the input distances of the dust layers used in the simulations.
Current usage metrics show cumulative count of Article Views (full-text article views including HTML views, PDF and ePub downloads, according to the available data) and Abstracts Views on Vision4Press platform.
Data correspond to usage on the plateform after 2015. The current usage metrics is available 48-96 hours after online publication and is updated daily on week days.
Initial download of the metrics may take a while.