Open Access
Fig. 3
Download original image
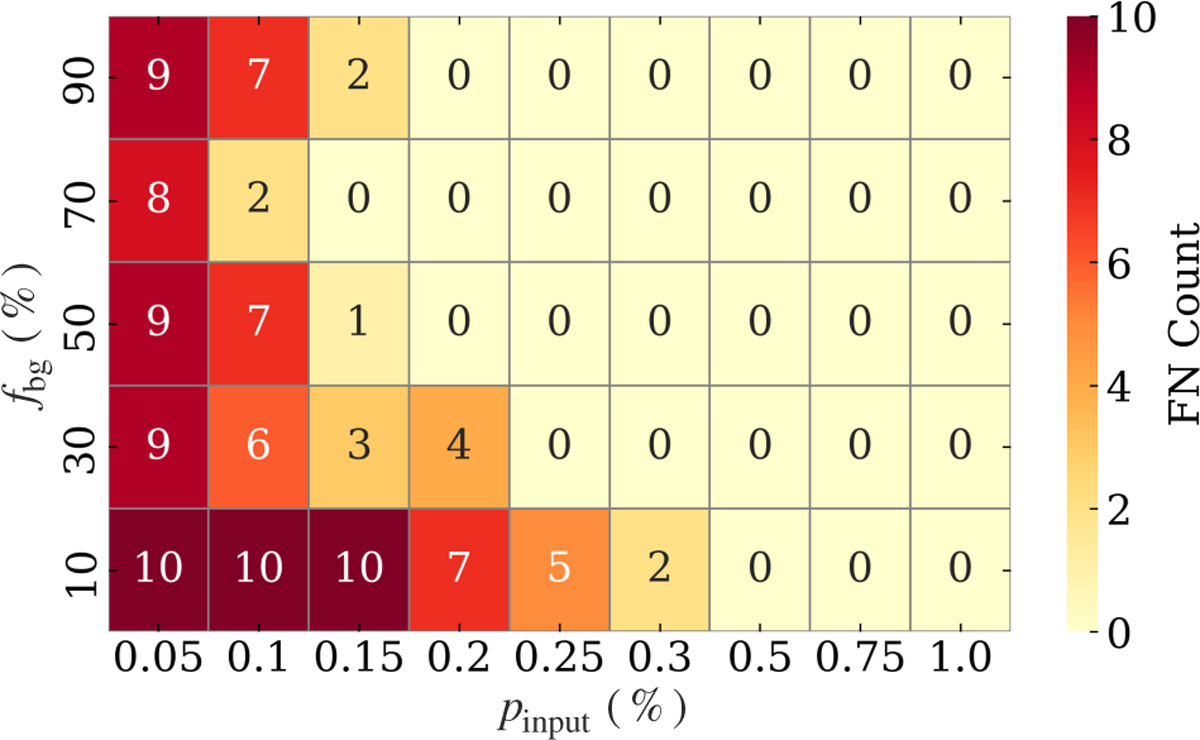
Heat map illustrating the number of FNs out of 450 single-cloud mock samples, each with a combination of pinput and fbg, evaluated across ten samples of ψ ranging from 0° to 180°. The color intensity and the number within each cell represent the resulting count of FNs.
Current usage metrics show cumulative count of Article Views (full-text article views including HTML views, PDF and ePub downloads, according to the available data) and Abstracts Views on Vision4Press platform.
Data correspond to usage on the plateform after 2015. The current usage metrics is available 48-96 hours after online publication and is updated daily on week days.
Initial download of the metrics may take a while.