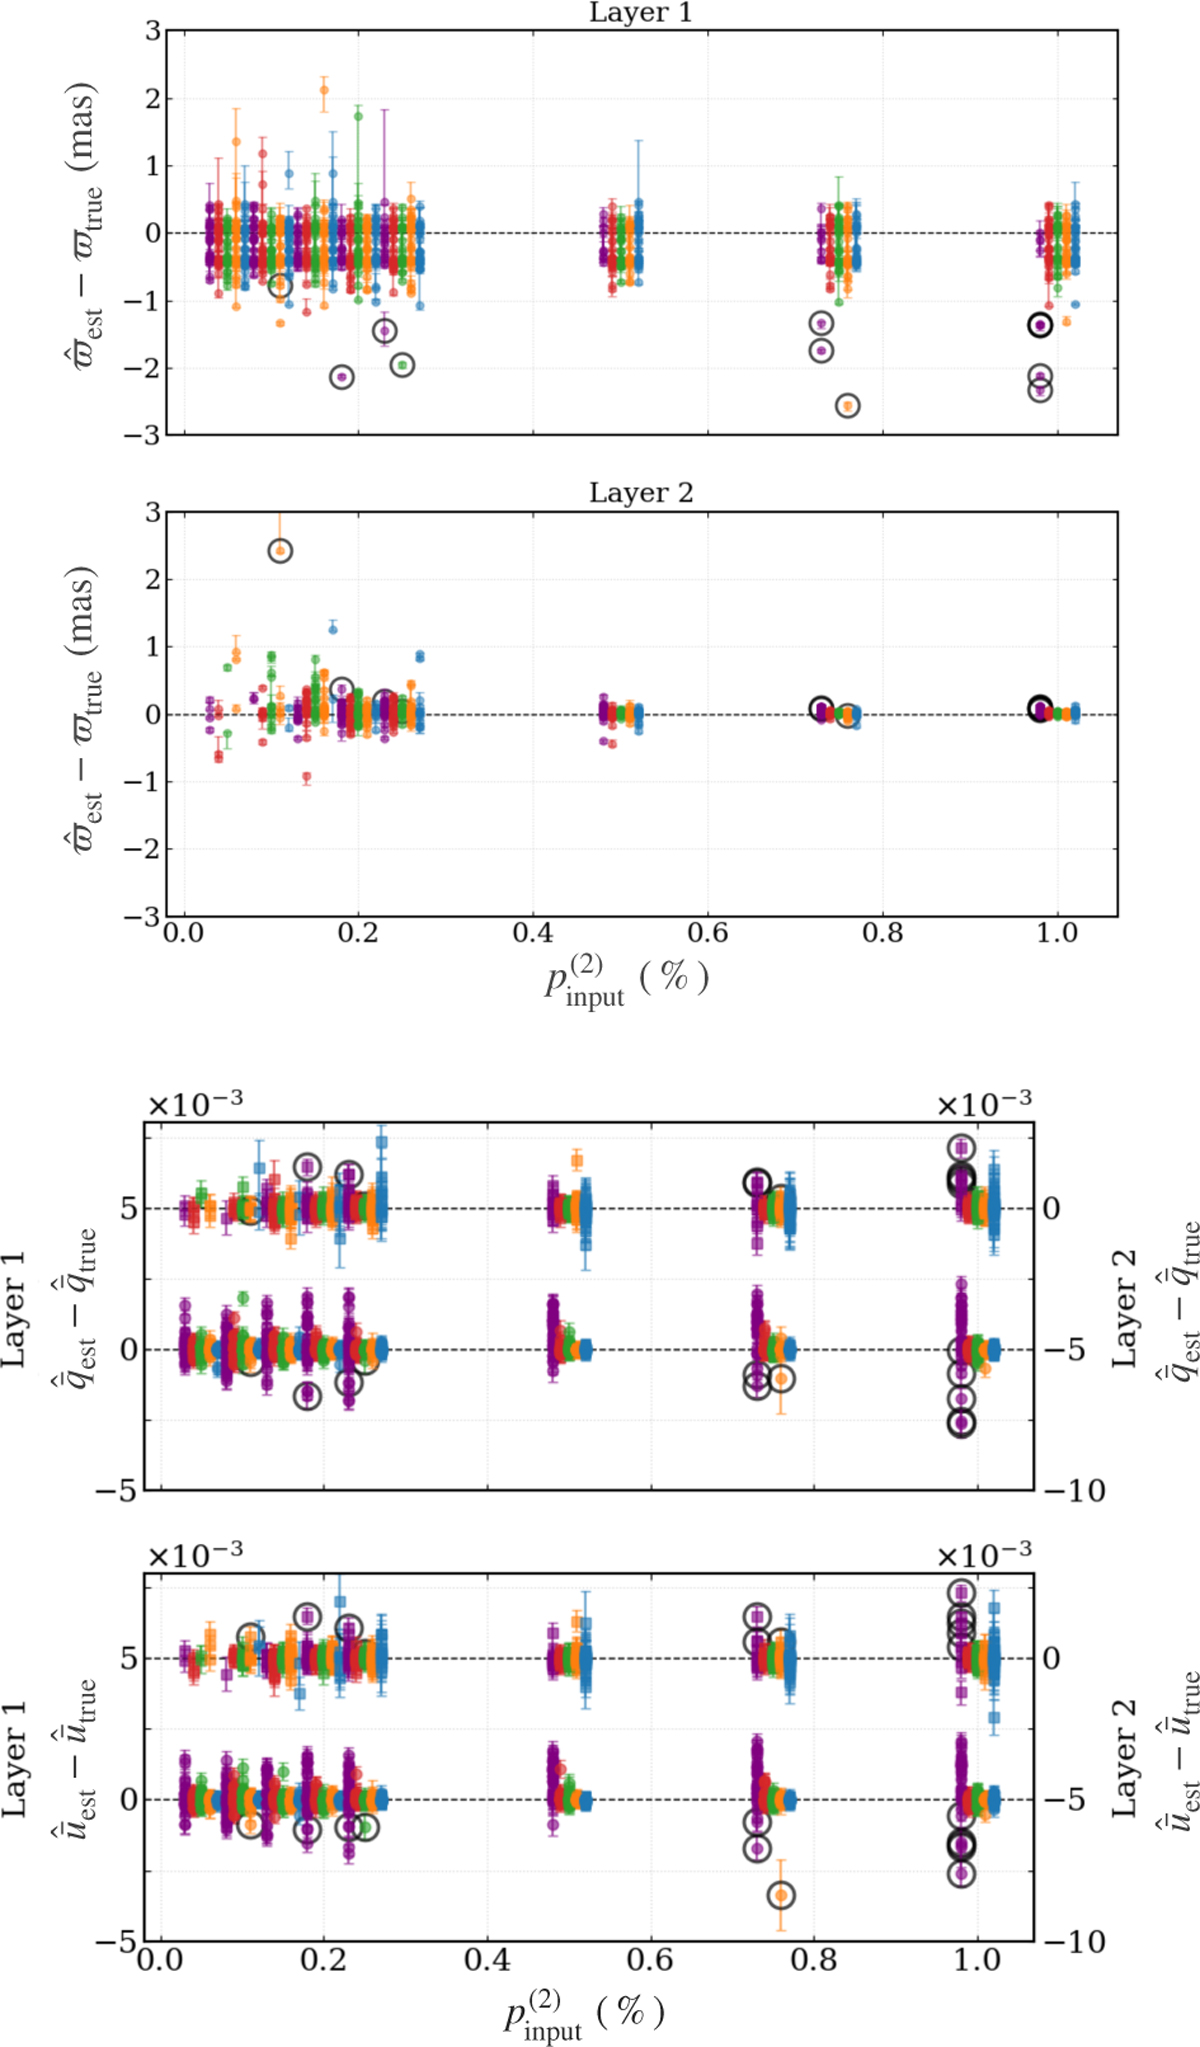
Fig. 5
Download original image
Performance testing of our method in recovering parallax (top panel) and Stokes parameters (bottom panel) of both layers in two-cloud sample tests. The color scheme is defined for different sets of fbg2 and is similar to fbg in Fig. 4. The horizontal dashed lines correspond to a perfect match between the estimated and true values. The open black circles indicate cases where an additional, spurious layer beyond the second layer is identified, while the first layer is missed. Additional details about the figure are provided in the text in Sect. 3.2.
Current usage metrics show cumulative count of Article Views (full-text article views including HTML views, PDF and ePub downloads, according to the available data) and Abstracts Views on Vision4Press platform.
Data correspond to usage on the plateform after 2015. The current usage metrics is available 48-96 hours after online publication and is updated daily on week days.
Initial download of the metrics may take a while.