Fig. 1.
Download original image
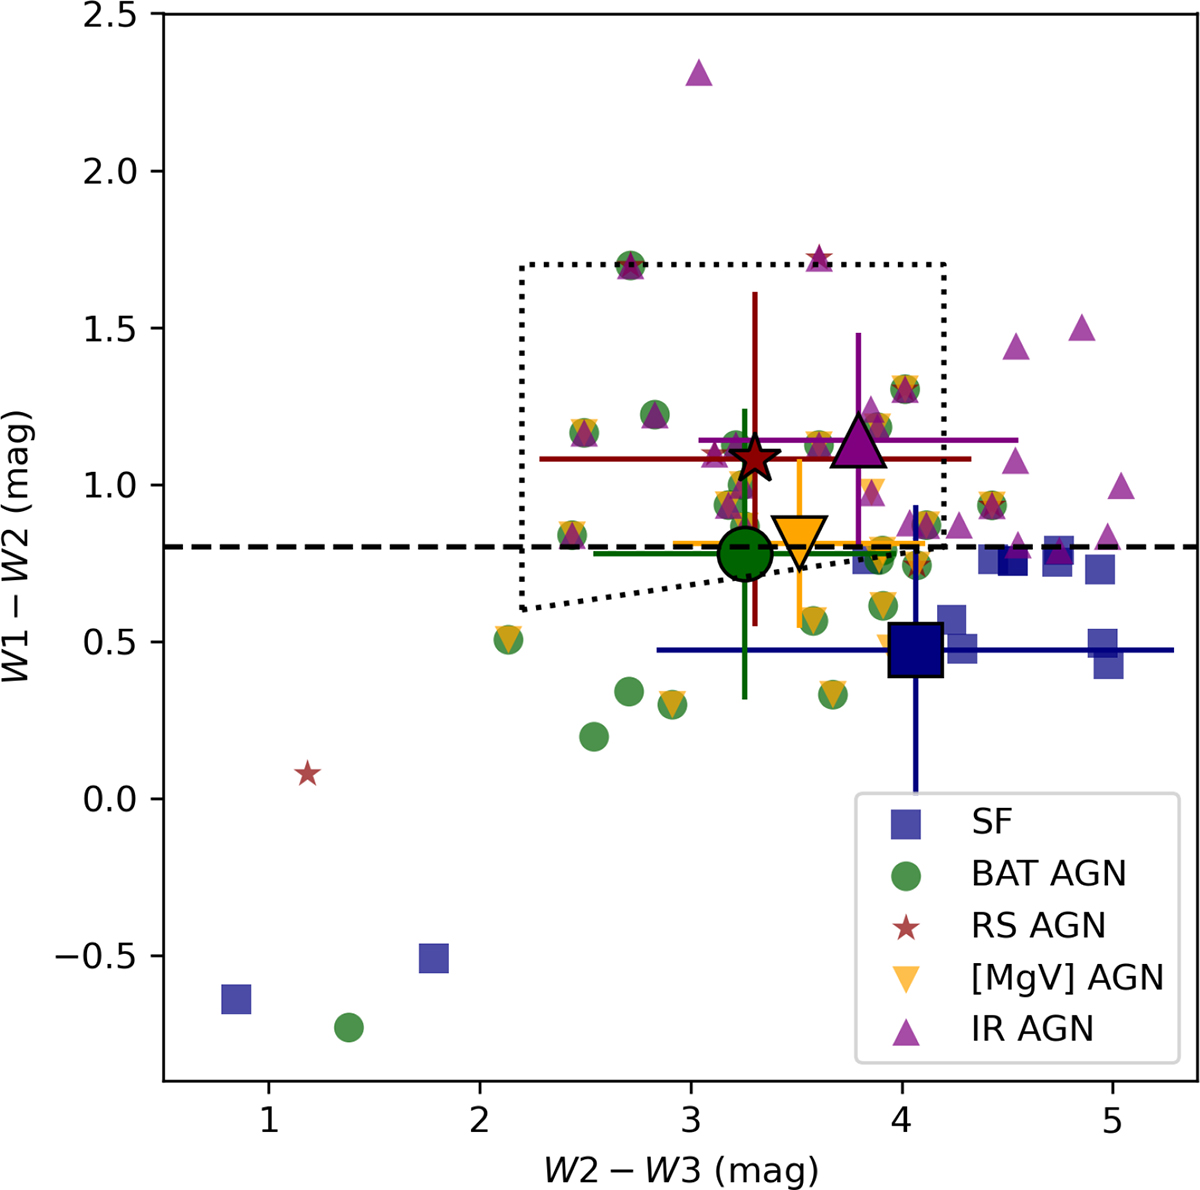
WISE colour–colour diagram showing the five subsamples, as indicated by the symbols. The uncertainties are comparable to the symbol sizes. The large symbols with error bars correspond to the mean values for each sub-sample, with the error bars representing the standard deviation. The dashed line represents the threshold W1 − W2 = 0.8, while the dotted polygon marks the region typically occupied by Seyfert galaxies (Jarrett et al. 2011).
Current usage metrics show cumulative count of Article Views (full-text article views including HTML views, PDF and ePub downloads, according to the available data) and Abstracts Views on Vision4Press platform.
Data correspond to usage on the plateform after 2015. The current usage metrics is available 48-96 hours after online publication and is updated daily on week days.
Initial download of the metrics may take a while.