| Issue |
A&A
Volume 705, January 2026
|
|
|---|---|---|
| Article Number | A59 | |
| Number of page(s) | 18 | |
| Section | Extragalactic astronomy | |
| DOI | https://doi.org/10.1051/0004-6361/202556775 | |
| Published online | 07 January 2026 | |
Impact of active galactic nuclei and nuclear star formation on the ISM turbulence of galaxies: Insights from JWST/MIRI spectroscopy
1
Centro de Astrobiología (CAB), CSIC-INTA, Ctra. de Ajalvir km 4, Torreón de Ardoz, E-28850 Madrid, Spain
2
Departamento de Física, CCNE, Universidade Federal de Santa Maria, Av. Roraima 1000, 97105-900 Santa Maria, RS, Brazil
3
European Southern Observatory, Karl-Schwarzschild-Strasse 2, Garching bei München, Germany
4
Instituto de Física Fundamental, CSIC, Calle Serrano 123, E-28006 Madrid, Spain
5
Universidade do Vale do Paraíba, Av. Shishima Hifumi, 2911, Cep 12244-000 São José dos Campos, SP, Brazil
6
Centro de Astrobiología (CAB), CSIC-INTA, Camino Bajo del Castillo s/n, E-28692 Villanueva de la Cañada, Madrid, Spain
7
Instituto de Astrofísica de Canarias, Calle Vía Láctea, s/n, E-38205 La Laguna, Tenerife, Spain
8
Departamento de Astrofísica, Universidad de La Laguna, E-38206 La Laguna, Tenerife, Spain
9
Departmento de Física de la Tierra y Astrofísica, Fac. de CC Físicas, Universidad Complutense de Madrid, E-28040 Madrid, Spain
10
Instituto de Física de Partículas y del Cosmos IPARCOS, Fac. CC Físicas, Universidad Complutense de Madrid, E-28040 Madrid, Spain
11
Department of Physics, University of Oxford, Denys Wilkinson Building, Keble Road, Oxford, OX1 3RH
UK
12
School of Mathematics, Statistics, and Physics, Newcastle University, Newcastle upon Tyne, NE1 7RU
UK
13
Observatoire de Paris, LUX, PSL University, Sorbonne Université, CNRS, F-75014 Paris, France
14
Collège de France, 11 Place Marcelin Berthelot, 75231 Paris, France
15
Max-Planck-Institut für Extraterrestrische Physik, Postfach 1312, 85741 Garching, Germany
16
Institute of Astrophysics, Foundation for Research and TechnologyHellas, 71110 Heraklion, Greece
17
School of Sciences, European University Cyprus, Diogenes Street, Engomi, 1516 Nicosia, Cyprus
18
Center for Astrophysics & Space Sciences, Department of Physics, University of California San Diego, 9500 Gilman Drive, San Diego, CA, 92093
USA
19
Observatorio de Madrid, OAN-IGN, Alfonso XII, 3, E-28014 Madrid, Spain
20
Instituto de Radioastronomía y Astrofísica (IRyA), Universidad Nacional Autónoma de México, Antigua Carretera a Pátzcuaro #8701, Ex-Hda. San José de la Huerta, C.P. 58089 Morelia, Michoacán, Mexico
21
Department of Physics & Astronomy, University of Alaska Anchorage, Anchorage, AK, 99508-4664
USA
22
Department of Physics, University of Alaska, Fairbanks, Alaska, 99775-5920
USA
23
Department of Physics & Astronomy, The University of Texas at San Antonio, One UTSA Circle, San Antonio, TX, 78249
USA
24
School of Physics & Astronomy, University of Southampton, Southampton, SO17 1BJ
UK
25
National Astronomical Observatory of Japan, National Institutes of Natural Sciences (NINS), 2-21-1 Osawa, Mitaka, Tokyo, 181-8588
Japan
26
Department of Astronomy, School of Science, Graduate University for Advanced Studies (SOKENDAI), Mitaka, Tokyo, 181-8588
Japan
27
Telespazio UK for the European Space Agency (ESA), ESAC, Camino Bajo del Castillo s/n, 28692 Villanueva de la Cañada, Spain
28
Department of Physics & Astronomy, University of South Carolina, Columbia, SC, 29208
USA
29
Kavli Institute for Particle Astrophysics & Cosmology (KIPAC), Stanford University, Stanford, CA, 94305
USA
30
Department of Physics, University of Oxford, Keble Road, Oxford, OX1 3RH
UK
31
School of Sciences, European University Cyprus, Diogenes street, Engomi, 1516 Nicosia, Cyprus
★ Corresponding author: This email address is being protected from spambots. You need JavaScript enabled to view it.
Received:
7
August
2025
Accepted:
31
October
2025
Abstract
Active galactic nuclei (AGNs), star formation (SF), and galaxy interactions can drive turbulence in the gas of the interstellar medium (ISM), which, in turn, plays a role in SF taking place within galaxies. The impact on molecular gas is of particular importance, as it serves as the primary fuel for SF. Our goal is to investigate the origin of turbulence and the emission of molecular gas, as well as low-and-intermediate-ionisation gas, in the inner few kpc of both AGN hosts and star-forming galaxies (SFGs). We used archival JWST MIRI/MRS observations of a sample consisting of 54 galaxies at z < 0.1. We present flux measurements for the H2 S(5)λ6.9091 μm, [ArII]λ6.9853 μm, [FeII]λ5.3403 μm, and [ArIII]λ8.9914 μm emission lines along with velocity dispersion estimated by the W80 parameter. For galaxies with coronal line emission, we included measurements of the [MgV]λ5.6098 μm line. We compared the line ratios to photoionisation and shock models to explore the origin of the gas emission. AGNs exhibit broader emission lines than SFGs, with the largest velocity dispersions observed in radio-strong (RS) AGNs. The H2 gas is less turbulent compared to ionised gas, while coronal gas presents higher velocity dispersions. The W80 values for the ionised gas show a decrease when going from the nucleus out to radii of approximately 0.5–1 kpc, followed by an outward increase up to 2–3 kpc. In contrast, the H2 line widths generally display increasing profiles with distance from the center. Correlations between the W80 parameter and line ratios such as H2S(5)/[Ar II] and [Fe II]/[Ar II] indicate that the most turbulent gas is associated with shocks, enhancing H2 and [Fe II] emissions. Based on the observed line ratios and velocity dispersions, the [FeII] emission is consistent with predictions of fast shock models, while the H2 emission is likely associated with molecules formed in the post-shock region. We speculate that these shocked gas regions are produced by AGN outflows and jet-cloud interactions in AGN-dominated sources; whereas in SFGs, they might be created through stellar winds and mergers. This shock-induced gas heating may be an important mechanism of AGN (or stellar) feedback, preventing the gas from cooling and forming new stars.
Key words: galaxies: active / galaxies: evolution / galaxies: ISM / galaxies: kinematics and dynamics
© The Authors 2026
 Open Access article, published by EDP Sciences, under the terms of the Creative Commons Attribution License (https://creativecommons.org/licenses/by/4.0), which permits unrestricted use, distribution, and reproduction in any medium, provided the original work is properly cited.
This article is published in open access under the Subscribe to Open model. This email address is being protected from spambots. You need JavaScript enabled to view it. to support open access publication.
1. Introduction
The interplay between active galactic nuclei (AGNs) or stellar-driven galactic winds and star formation (SF) in galaxies is a crucial aspect of galaxy evolution. Both AGNs and stellar winds can significantly suppress or regulate SF by injecting large amounts of energy into the interstellar medium (ISM; e.g. Silk & Rees 1998; Di Matteo et al. 2005; Hopkins et al. 2012; Dalla Vecchia & Schaye 2012; Heckman & Best 2014; Fierlinger et al. 2016; Harrison 2017; Harrison & Ramos Almeida 2024; Veilleux et al. 2020; Silk et al. 2024). The strong radiation field from AGNs or nuclear starburst, nuclear winds, and jets can all generate turbulence in the gas and induce shocks; in turn, this can disrupt the dense gas necessary for SF. These dynamic processes hinder or even prevent SF (i.e. negative feedback), as they inhibit the gas from condensing and cooling effectively. However, these mechanisms can also promote SF (i.e. positive feedback). For instance, fast outflows may enhance SF by compressing molecular clouds under pressure or by fostering SF within the outflowing material itself (Silk 2013; Zubovas & King 2014; Cresci et al. 2015; Maiolino et al. 2017; Gallagher et al. 2019; García-Bernete et al. 2021; Bessiere & Ramos Almeida 2022; Hermosa Muñoz et al. 2024). Consequently, the balance between these outflows and the gas available for SF can have a profound impact on the star-forming potential of galaxies. A central problem in this context is to understand the origin of the gas turbulence observed in the central regions of galaxies and to establish the role of shocks in driving it. Determining whether turbulence is primarily induced by AGN outflows, radio jets, or stellar feedback, as well as how it regulates the physical state of the ISM, is essential to assess its impact on galaxy evolution. Addressing this issue is crucial for disentangling the mechanisms of feedback that suppress or promote star formation in different environments.
Shock-induced turbulence, triggered by AGN activity or stellar winds, can excite a variety of transitions in molecular and ionised gas, enhancing its emission across multiple wavelengths (e.g. Dopita & Sutherland 1995; Contini & Viegas 2001; Allen et al. 2008; Dors et al. 2021; Riffel et al. 2021b; Venturi et al. 2021; Appleton et al. 2017, 2023; Audibert et al. 2023, 2025; Schönell et al. 2025; Rodríguez-Ardila & Cerqueira-Campos 2025). Understanding gas emission mechanisms and the resulting turbulence in the central regions of galaxies is crucial for advancing our knowledge of how feedback processes, driven by both stellar activity and AGNs, contribute to the evolution of galaxies.
Observations of the ionised gas kinematics using integral field spectroscopy (IFS) show that AGNs exhibit higher [OIII]λ5007 emission line widths compared to star-forming galaxies (SFGs), extending up to distances greater than one effective radius (Re) from the nucleus. In addition, high-luminosity AGNs, with L[O III] > 2 × 1040 erg s−1, display a sharp increase in line widths within 0.4 Re, which is associated with AGN-driven outflows (Wylezalek et al. 2020; Deconto-Machado et al. 2022; Gatto et al. 2024). Evidence of increased turbulence is detected in luminous and ultra-luminous infrared galaxies (U/LIRGs) using optical emission lines (e.g. Bellocchi et al. 2013; Arribas et al. 2014; Perna et al. 2022). Albán et al. (2024) found that radio-selected AGNs exhibit broader [OIII]λ5007 lines compared to those selected by other techniques, such as optical or infrared (IR) diagnostics. The authors conclude that this difference arises because radio-selected AGNs represent a population in which AGN-driven kinematic perturbations have been active for longer durations, consistent with the radio emission being driven by shocks from outflows. Studies of the ionised gas in the inner kpc of AGN hosts show that broadened or complex emission line profiles are generally associated with outflows or turbulence induced by the interaction of radio jets or outflows with the ISM (e.g. Mullaney et al. 2013; Fischer et al. 2018; Freitas et al. 2018; Förster Schreiber et al. 2019; Avery et al. 2021; Kakkad et al. 2022; Zhang et al. 2024; Davies et al. 2024; Speranza et al. 2024; Esposito et al. 2024; García-Bernete et al. 2024b; Hermosa Muñoz et al. 2024). In some cases, this interaction results in additional emission from gas excited by shocks (e.g. Riffel et al. 2021b; Venturi et al. 2021).
Vibrational and ro-vibrational H2 emission in the central few kpc of nearby AGN hosts and ULIRGs can be strongly enhanced by shocks from outflows or jet-cloud interactions (e.g. Ogle et al. 2010, 2025; Hill & Zakamska 2014; Colina et al. 2015; Kristensen et al. 2023; Riffel et al. 2021a,c, 2025; Costa-Souza et al. 2024; Villar Martín et al. 2023; Leftley et al. 2024; Bohn et al. 2024; Dasyra et al. 2024). These shocks can heat the gas, promoting the excitation of H2 molecules and leading to the emission of these diagnostic lines. A comparison of the emission lines from hot molecular gas and ionised gas, using near-IR lines, shows that the former are typically narrower than the latter, but both are observed in kinematically disturbed regions (KDRs) around AGNs and in ULIRGs (e.g. Emonts et al. 2017; Ramos Almeida et al. 2017, 2019, 2025; Bianchin et al. 2022; Riffel et al. 2023; Zanchettin et al. 2025).
With the use of the James Webb Space Telescope (JWST; Gardner et al. 2023) Mid-Infrared Instrument medium-resolution spectrometer (MIRI/MRS; Wright et al. 2015, 2023), it is possible to map the kinematics of multiple gas phases in the central regions of galaxies, including areas that are heavily obscured at optical wavelengths, as the extinction in the mid-IR is up to ∼40 times lower than in the optical (Gordon et al. 2023). This allows unprecedented access to the deeply embedded gas emission structures and processes in dusty galactic nuclei, such as AGN-driven winds, turbulence in the ISM produced by outflows and jets, as well as circumnuclear SF. Here, we use archival JWST MIRI/MRS observations of a large sample of AGN hosts and ULIRGs at redshifts z < 0.1 to compare the kinematics across warm molecular gas and low-to-moderate-ionisation phases. We investigate the origin of the gas emission and turbulence in these galaxies. We focus on the H2 0 − 0 S(5)λ6.9091 μm transition and a set of low-to-medium-ionisation fine-structure lines, including [Ar II]λ6.99 μm, [Fe II]λ5.34 μm, and [Ar III]λ8.99 μm. These lines are among the brightest in the mid-IR spectra and they often trace spatially extended emission in nearby AGNs and SFGs. Their excitation can arise from different mechanisms, such as photoionisation by massive stars or AGNs, as well as shocks produced by stellar and AGN-driven outflows and jets. The analysis of both the line intensities and their kinematics therefore provides powerful diagnostics of the physical conditions and dominant excitation processes in the nuclear regions of galaxies.
This paper is organised as follows. Section 2 describes the sample and Section 3 presents the data and measurements. Our main results are presented in Section 4, followed by a discussion on the origin of the gas emission and turbulence in Section 5. Finally, Section 6 summarises our key conclusions.
2. The sample
Our goal is to investigate the origin of the emission and the dynamics of warm molecular gas as well as low-and-medium-ionisation ionised gas. In local galaxies (z ≲ 0.1), the aforementioned emission lines are observed in Channels 1 and 2 of the MIRI/MRS, which provide angular resolutions of approximately 0.35–0.40 arcsec (FWHM; Law et al. 2023). Additionally, we used the [Mg V]λ5.6098 μm emission line to identify objects with high-ionisation gas and H2 S(3)λ9.6649 μm to investigate the origin of the molecular gas emission. The ionisation potentials are 7.9 eV for FeII (Nave & Johansson 2013), 15.8 eV for ArII (Sansonetti & Martin 2005), 27.6 eV for ArIII (Kaufman & Whaling 1996), and 109 eV for MgV (Biémont et al. 1999), as listed in the National Institute of Standards and Technology (NIST) Atomic Spectra Database Ionisation Energies Data (Kramida et al. 2014).
The sample was defined as follows: we queried the Mikulski Archive for Space Telescopes (MAST) portal for JWST observations of galaxies with z < 0.1 obtained using the MIRI instrument in the MRS observing mode. The redshift threshold was selected to allow the study of gas emission and kinematics on scales of hundreds of parsecs, enabling meaningful comparisons across objects with similar spatial resolutions. Our search was limited to projects with publicly available data that provide complete spectral coverage with MIRI/MRS, including all three sub-bands (short, medium, and long) and extended emission in the relevant emission lines, resulting in a sample of 54 galaxies. Table 1 summarises the properties of the sample, including the distance (D), hard X-ray (14–195 keV) luminosity (LBAT), radio powers at 1.4 GHz and 4.8 GHz (P1.4 GHz and P4.8 GHz), H-band luminosity (LH), and infrared luminosity (LIR) of each galaxy.
Properties of the sample.
In our sample, 25 objects (46%) are detected in the Swift BAT survey, while 51 objects (94%) have 1.4 GHz data, and 30 objects (56%) have measurements at 4.8 GHz (see notes in Table 1 for references). Table A.1 presents the list of galaxies and the corresponding details of the observational proposals. Strong correlations are found between radio power and X-ray luminosity for the objects detected in both bands. Specifically, the 1.4 GHz and 4.8 GHz radio powers show Pearson correlation coefficients of 0.79 and 0.85, respectively, with the X-ray luminosity. Additionally, for the objects detected at both radio frequencies, the 4.8 GHz and 1.4 GHz radio powers are tightly correlated, closely following a 1:1 relation, with a Pearson correlation coefficient of 0.96.
In this work, we are not focussed on discussing individual objects, many of which exhibit a rich abundance of physical properties. Instead, our goal is to investigate the general properties of the sample, specifically the physical characteristics of warm molecular gas and low-to-moderate-ionisation gas. Consequently, we do not present individual maps for all galaxies. We present our results by dividing the sample into five subsamples, where a single galaxy may belong to more than one group, defined as follows.
-
BAT AGN sub-sample: This sub-sample of X-ray selected AGNs is composed of 25 galaxies. It was obtained by cross-matching the sample with the 105-month catalog of hard X-ray sources (14–195 keV) from the Swift Burst Alert Telescope (BAT) survey (Oh et al. 2018), including all X-ray detected sources. The hard X-ray emission offers a direct measurement of AGN activity, as it predominantly captures the intrinsic emission from the AGN rather than scattered or reprocessed emissions. Additionally, it is significantly less affected by line-of-sight obscuration compared to optical wavelengths or softer X-ray bands.
-
RS AGN sub-sample: This sub-sample of radio-strong (RS) AGNs is composed of seven galaxies. SFGs typically exhibit 1.4 GHz radio luminosities below P1.4GHz = 1023 W Hz−1, although some can reach up to ∼1024 W Hz−1 (Condon et al. 2002; Jose et al. 2024). On average, AGNs exhibit radio luminosities higher than those expected purely from SFGs (e.g. Condon et al. 2002), due to additional emission from jets (Padovani 2017) and/or shocks generated by outflows (Zakamska et al. 2016). The standard definition of radio-loud AGNs identifies them as those with a ratio of 5 GHz radio luminosity to B-band luminosity of L5 GHz/LB ≳ 10 (e.g. Kellermann et al. 1989). However, several studies have used the 1.4 GHz radio power to distinguish between radio-loud and radio-quiet AGNs, often defining thresholds at P1.4 GHz = 1023 W Hz−1 (e.g. Best et al. 2005) or P1.4 GHz = 1024 W Hz−1 (e.g. Tadhunter 2016). Since most galaxies in our sample were detected at 1.4 GHz, we used their observed radio powers to define a sub-sample of RS AGNs. Only three objects in our sample have log P1.4 GHz/[W Hz−1]>24. On the other hand, our sample includes ULIRGs, for which the commonly used threshold of log P1.4 GHz/[W Hz−1]>23 might be insufficient to ensure the presence of an AGN. Therefore, we adopted an intermediate value of log P1.4 GHz/[W Hz−1]>23.7, which lies between the thresholds commonly used in the literature. This sample includes four ULIRGs (i.e. IRAS 09022−3615, Mrk 231, NGC 6240, and UGC 05101) all of which are classified as AGNs using the other methods adopted in this work. In these objects, a significant fraction of the radio emission may still be attributed to SF. Among all the RS AGNs, the only galaxy not included in any other AGN sample is the radio galaxy M87. In addition, we note that only two galaxies in this sample exhibit a clear radio excess: Cygnus A and M 87. This is evidenced by q23 < 0, where q23 = log(S23 μm/S1.4 GHz), with S23 μm and S1.4 GHz representing the flux densities at 23 μm and 1.4 GHz, respectively (Radcliffe et al. 2021). Therefore, interpretations regarding the role of AGNs in this sub-sample should be approached with caution.
-
[MgV] AGN sub-sample: This sub-sample is composed of 21 galaxies with coronal line emission. In brief, coronal lines are emitted by highly ionised gas with ionisation potentials of IP≳100 eV. They serve as reliable indicators of AGN activity, generated either by photoionisation from the AGN’s intense radiation field or by shocks associated with jets and outflows (e.g. Rodríguez-Ardila & Cerqueira-Campos 2025; Ramos Almeida et al. 2025). We used the [MgV]λ5.6098 μm emission line to select galaxies for this sub-sample, using the MIRI MRS datacubes. We show the [MgV] flux maps and line profiles for each galaxy in Fig. A.2.
-
IR AGN sub-sample: This sub-sample is composed of 27 IR-selected galaxies, based on the fact that AGNs exhibit an excess of IR emission, which arises from the dusty torus heated by the radiation from the central engine (Antonucci 1993; Netzer 2015). We selected the IR AGN sample based on magnitudes from the Wide-field Infrared Survey Explorer (WISE; Wright et al. 2010). We adopted the definition of Stern et al. (2012), considering AGNs as objects with a colour criterion of W1 − W2 ≥ 0.8. This criterion allows us to efficiently identify AGNs even in galaxies with significant host galaxy contamination and it is particularly sensitive to dust-obscured AGN populations (Assef et al. 2010; Stern et al. 2012).
-
SF sub-sample: The sub-sample comprises 13 SFGs that are not classified as AGNs by any of the methods described above and it is predominantly composed of U/LIRGs (i.e. seven ULIRGs and two LIRGs). Although some of these galaxies show evidence of buried or obscured AGNs, their gas excitation is predominantly driven by SF (Cicone et al. 2014; Su et al. 2023; García-Bernete et al. 2025).
Table 2 presents the mean properties of each sub-sample. The H-band luminosity can be used as a reliable proxy for stellar mass (Davies et al. 2015), allowing us to compare the stellar mass distributions across different subsamples. The sample includes objects with LH in the range 106–1011L⊙. The mean H-band luminosities for all subsamples are similar, with the BAT AGN and [Mr V] AGN sub-samples presenting slightly smaller values than the other samples. In addition, we performed two-sample Kolmogorov–Smirnov (KS) tests to assess whether the H-band luminosity distributions of the AGN and SF samples differ significantly. The p-values indicate that the AGN and SF samples are drawn from the same parent population.
Mean properties for each sub-sample. Uncertainties are the standard deviation of each parameter.
The four AGN sub-samples were defined using tracers of different physical processes. The BAT sub-sample directly probes the emission of the hot corona located above the AGN accretion disk, while the RS sub-sample is associated with the mechanical energy released in the form of jets. The [Mg V] sub-sample is related to the local gas physics, as it primarily traces the ionisation parameter rather than directly probing the AGN emission, similar to optical diagnostic diagrams (Baldwin et al. 1981; Negus et al. 2023). Coronal line emission, however, can also be associated with shocked gas regions in the inner ∼1 kpc of AGN hosts (Rodríguez-Ardila & Cerqueira-Campos 2025; Rodríguez-Ardila et al. 2025). Finally, the IR sub-sample traces the physics of the hot dust heated by AGN radiation. Since these physical processes are interconnected and can occur simultaneously in an AGN, many of our objects appear in more than one sub-sample. In Fig. A.1, we show the Venn diagram illustrating the overlap among the different AGN sub-samples.
In Fig.1, we present the WISE colour-colour diagram for our subsamples. The mean W1 − W2 and W2 − W3 values for all AGN sub-samples fall within the region typically occupied by Seyfert galaxies, as indicated by the dotted polygon. The IR AGN sub-sample includes representatives of dustier objects, exhibiting larger colours along both axes of the diagram; some BAT and [Mg V] AGNs exhibit lower W1 − W2 values than typical Seyfert galaxies, consistent with low-luminosity AGNs; and objects in the SF sample are located in a region consistent with Starburst galaxies; finally, all three associations are consistent with the locations of these classes among WISE objects (Wright et al. 2010).
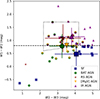 |
Fig. 1. WISE colour–colour diagram showing the five subsamples, as indicated by the symbols. The uncertainties are comparable to the symbol sizes. The large symbols with error bars correspond to the mean values for each sub-sample, with the error bars representing the standard deviation. The dashed line represents the threshold W1 − W2 = 0.8, while the dotted polygon marks the region typically occupied by Seyfert galaxies (Jarrett et al. 2011). |
3. Data reduction and measurements
We used archival mid-IR JWST spectroscopic data obtained with the MIRI/MRS instrument (Wells et al. 2015; Labiano et al. 2021; Argyriou et al. 2023) of a sample of nearby galaxies. The observations were carried out using different observational strategies, according to the scientific objectives of the approved proposals. We downloaded the processed data from MAST archive, using a set of filters (obs_collection= ’JWST’, intentType= ’science’, dataRights= ’PUBLIC’, instrument_name =’MIRI/IFU’, calib_level = 3, proposal_id=pidm obs_id= ’jw*{pid}-c*’), where pid refers to the proposal IDs listed in the table, identified from the list of approved projects up to cycle 3. These data were processed using version 1.16.1 of the JWST Science Calibration Pipeline (Bushouse et al. 2024), employing the reference file jwst_1303.pmap.
The MIRI/MRS field of view (FoV) for channel 1 is 3.2 × 3.7 arcsec2, while channel 2 has a FoV of 4.0 × 4.8 arcsec2. Before performing the emission line flux and kinematic measurements, we rebinned the channel 1 data cubes to a spaxel size of 0.17 arcsec and convolved them with a Gaussian function with FWHM = 0.40 arcsec to match the angular sampling and spatial resolution of the channel 2 cubes. Subsequently, each spaxel in the cube was replaced with the average of its nearest neighbors within a 3×3 spaxel box. This process minimises the residual instrumental effects, particularly the continuum wiggles caused by the under-sampling of the point spread function (PSF; Law et al. 2023).
We performed the flux measurements and calculated the velocity dispersion, parametrised by the W80 parameter, which is defined as the width encompassing 80 per cent of the total line flux. These measurements were carried out for the following emission lines: H2 S(5)λ6.9091 μm, H2 S(3)λ9.6649 μm, [ArII]λ6.9853 μm, and [ArIII]λ8.9914 μm, [FeII]λ5.3403 μm, and [MgV]λ5.6098 μm. For each emission line, we subtracted the continuum contribution by fitting a linear function to regions adjacent to the line. The line profile was then integrated within a 3000 kms−1 window centered on the emission line. We only considered spaxels where the emission line was detected with s/n > 5, determined as the ratio between the line profile amplitude and the standard deviation of the adjacent continuum within a 1000 kms−1 window. Figure 2 presents several examples of the flux and W80 measurements for the emission lines H2 S(5)λ6.9091 μm, [ArII]λ6.9853 μm, [FeII]λ5.3403 μm, and [ArIII]λ8.9914 μm in the galaxy Arp 220. The gray regions indicate areas where the corresponding emission line is either not detected with s/n > 5 or lies outside the FoV of the MIRI instrument. The measured W80 values were corrected for instrumental broadening using the resolving power described by R = 4603 − 128 × λ[μm] (Jones et al. 2023), along with the relation W80 = 1.09 × FWHM for a Gaussian profile.
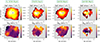 |
Fig. 2. Examples of flux (top panels) and W80 (bottom panels) maps for Arp 220. From left to right, the H2 S(5)λ6.9091 μm, [ArII]λ6.9853 μm, [FeII]λ5.3403 μm, and [ArIII]λ8.9914 μm. The central crosses identify the location of the peak of the continuum, corresponting to the western nucleus, used as reference to calculate radial distances from the galaxy nucleus. The gray regions correspond to locations where the corresponding emission line is not detected with a signal-to-noise ratio of s/n > 5 and regions not covered by the MRS FoV. |
4. Results
We used the W80 parameter to trace the velocity dispersion of the gas, which can be associated with turbulence and kinematic disturbances in the nuclear regions. In Fig. 3, we present the nuclear W80 distributions for the H2 S(5)λ6.9091 μm, [FeII]λ5.3403 μm, [ArII]λ6.9853 μm, and [ArIII]λ8.9914 μm emission lines (from top to bottom) for the BAT AGN, RS AGN, [MgV] AGN, IR AGN, and SF sub-samples (from left to right). These values are computed as the flux-weighted mean W80 values measured for spaxels within a 0.5 arcsec radius aperture. We observed that for all AGN samples, the H2 emission lines consistently present the lowest mean values of W80. Furthermore, the W80 values of the ionised gas emission lines increase from [FeII] through [ArII], reaching the highest values for [ArIII], following the order of increasing ionisation potential. These higher W80 values indicate enhanced gas turbulence in the more highly ionised regions. For example, the mean difference of W80 between [FeII] and H2, considering all AGN sub-samples, is 56 ± 28 km s−1, while the mean difference between [ArIII] and [FeII] is 115 ± 35 km s−1. On the other hand, the SF sub-sample shows similar mean W80 values for H2, [FeII], and [ArII], while [ArIII] exhibits higher values. Finally, we note that the AGN samples include objects with W80 > 500 kms−1, which exceed the values expected for motions solely governed by the gravitational potential of galaxies and are commonly used as a criterion to identify outflows in AGN hosts in the Local Universe (e.g. Wylezalek et al. 2020). Even smaller values, around ≳300 kms−1, have also been linked to ionised gas outflows in low-luminosity AGNs (Riffel et al. 2023; Gatto et al. 2024). Such high W80 also reflects strong turbulence associated with AGN-driven outflows. In addition, three galaxies in the SF sample (M104, IRAS19542+1110, and IRAS13120−5453) exhibit nuclear W80 values exceeding 500 km s−1. In M104, this is observed across all ionised-gas emission lines, while in the other two it is present only in [Ar III].
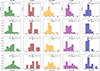 |
Fig. 3. Nuclear W80 values for the H2 S(5), [Fe II], [Ar II], and [Ar III] emission lines are ordered by increasing ionisation potential from top to bottom, shown for the five subsamples, displayed in separate columns. The W80 values are estimated as the flux weighted mean W80 values of spaxels within a radius of 0.5 arcsec centered at the peak or the continuum emission. The mean values (vertical dotted lines), standard error, and the number of galaxies are displayed in each panel. |
In Fig. 4 we show W80 radial profiles for the H2 (top left), [FeII] (top right), [ArII] (bottom left) and [ArIII] (bottom right) for the five sub-samples. These radial profiles were constructed by computing the median W80 and median radii values within 250 pc radial bins, considering all spaxels in all galaxies in each sample. The radial distances are calculated relative to the position of the peak of the continuum emission at 6.75 μm. The bin size was chosen as a compromise between the angular resolution for more distant objects and the field-of-view size for nearer ones. The bin width is smaller than the PSF radius only for the four most distant objects (D ≳ 300 Mpc). The number of galaxies used in each bin is indicated next to each data point. Fig. C.1 presents the same W80 radial profiles, but grouping the four emission lines for each sub-sample.
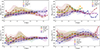 |
Fig. 4. Radial W80 profiles for H2 (top-left), [FeII] (top-right), [ArII] (bottom-left), and [ArIII] (bottom-right) for the five subsamples, as indicated by the different colours. These profiles are computed as median values of W80 and distance of the spaxel from the position of the continuum peak, within circular rings of 250 pc width. The numbers next to each point indicate the number of galaxies used to compute it, and the shaded regions represent the range between the 25th and 75th percentiles of the W80 values within each radial bin, illustrating the spread of values observed in each emission line. |
The lowest values of W80 at most radii are found for the SF sample across all emission lines within distances up to 1.5–2 kpc, beyond which the number of objects with spatial coverage for larger distances becomes small. An exception is seen in [ArIII], where the W80 values for SFGs at distances greater than 1 kpc exceed those in AGNs; however, only two SFGs show emission in this line beyond 1 kpc. For the ionised gas lines, there is a trend of decreasing W80 values from the nucleus up to ∼0.5 − 1 kpc, followed by an increase with radius in more distant regions. These variations likely reflect changes in the turbulent motions of the gas across different spatial scales. This behaviour is less evident in [FeII], where the radial profiles show more monotonically increasing values with the distance from the nucleus, except for the RS AGNs. At distances larger than ∼2 kpc, the W80 values start to decrease, but the number of objects with measurements at these scales is very reduced. For H2, the radial profiles show values increasing with distance from the nucleus for all subsamples, except in the RS AGNs, where a similar behaviour (to that described above for the ionised gas) was observed. Furthermore, the gas velocity dispersion values in our SF sample are significantly higher than those observed in low-z SFGs, which typically exhibit σ ≈ 10–40 km s−1 or W80 ≈ 25–100 km s−1 (e.g. Epinat et al. 2010). Instead, our measurements are comparable to those observed in local U/LIRGs, which are often attributed to gas outflows (e.g. Piqueras López et al. 2012; Bellocchi et al. 2013; Arribas et al. 2014).
Emission-line flux ratios can be used to investigate the origin of gas emission, while the line widths provide insights into the origin of gas turbulence and the behaviours observed in the radial profiles of W80. In Fig. 5, we present the W80 density maps for [FeII]λ5.3403 μm versus the flux ratios H2 S(5)λ6.9091 μm/[ArII]λ6.9853 μm (top panels), [FeII]λ5.3403 μm/[ArII]λ6.9853 μm (central panels), and [ArIII]λ8.9914 μm/[ArII]λ6.9853 μm (bottom panels) for the different subsamples. These maps were constructed using spaxel-based measurements.
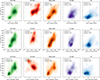 |
Fig. 5. Density maps of W80 for [Fe II] λ 5.3403 μm emission line as a function of the flux ratios: H2 S(5) λ 6.9091 μm/[Ar II] λ 6.9853 μm (top panels), [Fe II] λ 5.3403 μm/[Ar II] λ 6.9853 μm (middle panels), and [Ar III] λ 8.9914 μm/[Ar II] λ 6.9853 μm (bottom panels). The contours are spaced at intervals of 10% in data density. Results are shown for the different subsamples, as identified in the title of each panel. |
As observed in Fig. 5, the SF sample exhibits the highest densities at W80 ≲ 300 km s−1, while the AGN samples display higher values, typically ranging between 300 and 600 km s−1; there is a secondary clustering in the distribution of points at values similar to those of SFGs, except for the RS AGNs. The clustering of points with lower values of W80 and line ratio (the secondary clustering) is associated with spaxels located closer to the nucleus, compared to the clustering of points with higher values of these parameters. For regions with W80 < 300 km s−1 (and low line ratios, as seen in Fig. 5), the median distance of spaxels from the nucleus is 234, 282, and 340 pc for the BAT, [Mg V], and IR AGN samples, respectively. For regions with W80 < 300 km s−1, these distances increase to 267, 321, and 534 pc for the same samples. The secondary clustering detected in the AGN samples is probably linked to SF within the MIRI FoV, as observed in several of these galaxies (e.g. Ricci et al. 2018; Zanchettin et al. 2024; Cassanta et al. 2025). The highest W80 values for the AGN samples reach 800 km s−1, whereas for the SF sample, the maximum values reach up to 600 km s−1. The BAT and [Mg V] AGN subsamples show remarkably similar distributions in these plots. This is not surprising, since both are direct tracers of AGN emission, either through the X-rays produced by the central engine or through the high-energy photons required to ionise the coronal gas. For all subsamples, a trend of increasing H2 S(5) λ6.9091 μm/[Ar II] λ6.9853 μm and [Fe II] λ5.3403 μm/[Ar II] λ6.9853 μm with the line width of [Fe II] is observed. However, the SF sample exhibit lower values of flux ratios compared to the AGN samples. A similar trend is observed with the [Ar III]/[Ar II] flux ratio (bottom panels), a diagnostic of the ionisation degree of the gas since it involves lines of the same element with different ionisation states. However, this trend is only evident for the BAT, [Mg V], and IR AGN samples. For the SF sample, most points are concentrated at low flux ratios and W80 values, with some contours extending to higher values. In contrast, the RS AGN sample exhibits two structures: one with W80 < 600 km s−1 spanning a wide range of [Ar III]/[Ar II] ratios and another with W80 > 600 km s−1 and lower flux ratios.
5. Discussion
As presented in the previous section, we found that: (i) AGNs exhibit higher gas turbulence, as indicated by the emission line widths, compared to SFGs; (ii) there is a trend of increasing gas turbulence with distance from the nucleus, which is more evident for H2 and [Fe II] (Fig. 4). Overall, RS AGNs present more turbulent gas compared to other samples; (iii) there is a correlation between the width of the [Fe II] emission line and the line ratios H2 S(5) λ6.9091 μm/[Ar II] λ6.9853 μm and [Fe II] λ5.3403 μm/[Ar II] λ6.9853 μm for all sub-samples (Fig. 5). However, only AGN samples show a trend of increasing [Ar III] λ8.9914 μm/[Ar II] λ6.9853 μm with gas turbulence. In this section, we investigate the origin of the observed behaviour in the W80 radial profiles and the physical mechanisms responsible for the line emission in our sample.
5.1. W80 radial profiles
When gas motions are governed by the gravitational potential, a decrease in the velocity dispersion with increasing distance from the nucleus is expected; therefore, the observed W80 radial profiles in our sample cannot be solely explained by virial motions. Such profiles could be interpreted as being generated by outflows or associated with shocks that enhance the turbulence of the gas (e.g. Wylezalek et al. 2020; Ruschel-Dutra et al. 2021; Audibert et al. 2023; Bessiere et al. 2024). Similar increases in velocity dispersion with distance from the nucleus are observed in the inner few hundred parsecs of nearby AGN hosts, in both hot molecular gas (traced by the H2 2.1218 μm line) and ionised gas (traced by the Brγ line), based on near-IR integral field spectroscopy observations of a sample of 31 AGNs. In those observations, KDRs were detected in 94% of the cases for the ionised gas and in 76% for the hot molecular gas (Riffel et al. 2023). A similar result is found using a larger sample of 88 AGNs, in which flat or increasing velocity dispersion profiles are observed within the inner 200 pc for obscured, unobscured, and LINER sources, including in the coronal gas traced by the [Si VI] 1.9641 μm emission line (Delaney et al. 2025). The origin of the enhanced line widths in these sources is associated with outflows and the shocks they produce (e.g. Riffel et al. 2021c). On galaxy-wide scales, AGN hosts exhibit enhanced velocity dispersion relative to normal galaxies, extending out to distances of up to 2 effective radii, as revealed by observations from the Mapping Nearby Galaxies at Apache Point Observatory (MaNGA) survey using the [O III] λ5007 emission line (Wylezalek et al. 2020; Albán et al. 2024). Radio–selected AGNs exhibit the largest differences at all radii, indicating that AGN–driven kinematic perturbations in this population have been active for longer durations than in purely photoionised AGNs, consistent with radio emission originating from shocks associated with outflows (Albán et al. 2024). On the other hand, Kukreti et al. (2025), using MaNGA data, find that radio AGNs exhibit higher [O III] λ5007 velocity dispersions than optical AGNs within the inner 0.5 effective radii, but show lower values at larger radii. These authors suggest that the discrepancy with the results of Albán et al. (2024) could be explained by the presence of low-luminosity AGNs in their optical AGN sample, which are not included in the Albán et al. (2024) sample due to different selection methods. Despite the discrepancies at large distances from the nucleus, the results for the central regions of the galaxies, which are the focus of the present work, indicate that radio AGNs exhibit higher gas turbulence.
Recently, Marconcini et al. (2025a) modelled the ionised gas kinematics of a sample of ten galaxies observed with the Multi Unit Spectroscopic Explorer (MUSE), using the MOKA3D tool (Marconcini et al. 2023). They found that ionised outflows exhibit constant or slightly decreasing velocities within the inner 1 kpc from the nucleus, followed by a rapid increase, very similar to the behaviour observed in our sample. Marconcini et al. (2025a) argued that the increase in outflow velocity, relative to the galaxy escape velocity, was observed in the transition region, where a momentum-driven phase shifts to an energy-conserving phase beyond 1 kpc, with the outflow expanding as an isothermal, consistent with theoretical predictions of AGN outflows (e.g. King & Pounds 2015). Thus, the observed behaviour of the W80 radial profiles in our sample, when compared with previous results, suggests that they are associated with energy-conserving winds driven by AGNs or SF that are capable of escaping the bulge of the galaxy, in both low-ionisation and warm molecular gas phases. These findings indicate that the enhanced gas turbulence observed in our sample may play a significant role in the evolution of the host galaxies. However, a comprehensive analysis of the gas kinematics, including detailed modeling of individual sources, is required to fully characterise the outflow properties and assess their potential impact on SF.
5.2. Origin of the emission
The emission of [FeII] is highly sensitive to shocks, increasing significantly when shocks release iron from dust grains (Oliva et al. 2001; Hashimoto et al. 2011; Aliste Castillo et al. 2025). The emission of H2 lines can also be enhanced in regions of shocked gas (Hollenbach & McKee 1989; Guillard et al. 2009; Kristensen et al. 2023; Appleton et al. 2023; Godard et al. 2024; Zanchettin et al. 2025). The [Ar III] λ8.9914 μm/[Ar II] λ6.9853 μm flux ratio can be used to map the ionisation degree and the intensity of the incident radiation field in photoionised gas regions, as their parent ions have significantly different ionisation potentials; namely, 15.8 eV and 27.6 eV for ArII and for ArIII, respectively. The observed trend of increasing W80 with increasing values of the H2 S(5)/[Ar II]λ6.9853 μm and [Fe II]λ5.3403 μm/[Ar II]λ6.9853 μm (first two rows of Fig. 5) could be interpreted as an additional contribution from shocks to the excitation of H2 and [FeII] emission lines. On the other hand, an increase in the [Ar III]λ8.9914 μm/[Ar II]λ6.9853 μm ratio for the larger W80, seen for the AGN samples, might suggest that although part of the gas is in the outflow, it remains predominantly photoionised by the central AGN.
To further investigate the origin of gas turbulence and the trends observed in emission-line flux ratios, we present in Fig. 6 density plots for the [Fe II]λ5.3403 μm/[Ar II]λ6.9853 μm versus H2 S(5)/[Ar II]λ6.9853 μm (top panels) and [Fe II]λ5.3403 μm/[Ar II]λ6.9853 μm versus [Ar III]λ8.9914 μm/[Ar II]λ6.9853 μm (bottom panels), for all subsamples. A strong correlation is observed for the first pair of intensity ratios in all samples, with Pearson correlation coefficients ranging from 0.53 to 0.76. As [Ar II] is predominantly produced by photoionisation, while [Fe II] and H2 are more sensitive to shocks, the observed correlation suggests that these latter lines trace shock-excited gas, particularly at larger distances from the nucleus. Moreover, the increase in line ratios with line widths (Fig. 5) provides strong evidence that the enhanced gas turbulence in these regions is driven by shocks. A much weaker trend is observed between [FeII]λ5.3403 μm/[ArII]λ6.9853 μm and [ArIII]λ8.9914 μm/[ArII]λ6.9853 μm, and only for the AGN samples (excluding the RS AGN). No clear relationship is observed between these line ratios for the SF sub-sample, where argon emission is attributed to SF. Since the [Fe II] and H2 fluxes increase relative to [Ar II] emission and also increase with line width, this suggests that both [Fe II] and H2 exhibit enhanced emission due to shocks, which could be associated with stellar winds and mergers. This is consistent with the fact that the SF sub-sample is predominantly composed of U/LIRGs, which are known for intense SF activity and their presence in merger systems. Similarly, no clear relationship is observed between these line ratios for the RS AGN sample. In this case, the possible origin of the shocked [Fe II] and H2 gas may be associated with radio emission, stellar winds, or interactions in the U/LIRGs of this sub-sample.
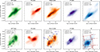 |
Fig. 6. Density plots for the [Fe II]λ5.3403 μm/[Ar II]λ6.9853 μm versus H2 S(5)/[Ar II]λ6.9853 μm (top panels) and [Fe II]λ5.3403 μm/[Ar II]λ6.9853 μm versus [Ar III]λ8.9914 μm/[Ar II]λ6.9853 μm (bottom panels). The dark red lines (bottom-right panel) show predictions from photoionisation models of star-forming regions, assuming stellar clusters aged 6 and 7 Myr. Solid lines indicate different gas densities, dotted lines correspond to varying ionisation parameters (as labelled in the figure), and the predictions for both cluster ages are connected by dashed lines. Similarly, results from AGN photoionisation models are shown as dark blue lines (bottom-central panel). The gray lines and filled circles (bottom-left panel) are predictions of fast shock models from Pereira-Santaella et al. (2024) using the MAPPINGS V code (Sutherland & Dopita 2017) for log RP = 6 (dashed) and log RP = 8 (continuous). The numbers indicate the shock velocities in kms−1. |
We can compare the observed emission-line ratios with predictions from shock and photoionisation models. The results from fast shock models by Pereira-Santaella et al. (2024), using the MAPPINGS V code (Dopita & Sutherland 1996; Sutherland & Dopita 2017), are shown overlaid as gray lines in the bottom-left panel of Fig. 6. A short description of these models are presented in Appendix D. Although these authors produced an extensive grid of models (see their work for more details), we only show a subset in the figure to avoid overcrowding. The displayed models assume solar metallicity, shock velocities (vs) ranging from 80 to 500 km s−1, and ram pressure parameters defined as  , with values of 106 and 108, where nH is the gas volume density. We also constructed extensive photoionisation model grids for AGNs and SF using the CLOUDY code (Ferland et al. 2017), as detailed in Appendix D. The SF models are shown as dark red lines in the bottom-right panel of Fig. 6. We present the predictions for gas densities, namely, log(nH/cm−3) = 2 and 4, along with ionisation parameters of log U = −4, −3, and −2, based on spectral energy distributions (SEDs) generated with the STARBURST99 code (Leitherer et al. 1999) for stellar clusters aged 6 Myr (yielding higher [Ar III]/[Ar II] ratios) and 7 Myr (lower ratios). These models are able to reproduce the lower line ratios, supporting a interpretation that they originate from gas photoionised by young stellar populations. The predictions from AGN photoionisation models are shown as blue lines in the bottom-central panel of Fig. 6, for densities of log(nH/cm−3) = 2, 5, and 6, and ionisation parameters of log U = −1 and −3. These models are able to reproduce the highest line ratios, including the extreme [Ar III]/[Ar II] values observed, which are not well matched by the shock models.
As shown, the observed [Fe II]λ5.3403 μm/[Ar II]λ6.9853 μm flux ratios align well with the values predicted by shock models. In contrast, the [Ar III] λ8.9914 μm/[Ar II] λ6.9853 μm ratios exhibit values higher than those predicted by shock models, but they can be aptly reproduced by AGN photoionisation models. In addition, the lowest values of both ratios are consistent with predictions from SF photoionisation models.
In Fig. 7, we display the density plots of [Fe II]λ5.3403 μm/[Ar II]λ6.9853 μm and W80 of the H2S(5) line against the H2S(5)/H2S(3) line ratio, which is a tracer of the H2 temperature and is enhanced in shock dominated-regions (e.g. Zakamska 2010; Pereira-Santaella et al. 2014; Togi & Smith 2016; Dan et al. 2025; Riffel et al. 2025). The observed values for this ratio are consistent with those predicted by low velocity shock models (2–90kms−1), as indicated by the vertical lines representing predictions by the models from Kristensen et al. (2023). However, no evident correlation was observed. This indicates that if the H2 emission is produced by shocks, these are not the same shocks responsible for the [FeII] emission (Hollenbach & McKee 1989; Mouri et al. 2000; Allen et al. 2008). This is expected, as the shock waves produced by fast shocks with velocities of 200 − 300km s−1 necessary to generate ionised gas emission would lead to the dissociation of H2 molecules. On the other hand, the tight correlation observed between the [FeII] and H2 emission (top row of Fig. 6) indicates that they share the same physical origin. A possible interpretation for this correlation is that the H2 emission originates in the post-shock gas, where the molecules reform after being dissociated by the fast shock (Guillard et al. 2009; Richings & Faucher-Giguère 2018a,b). Another explanation is the excitation of H2 in the molecular shock precursor, as observed in NGC7319. In this case, the ionised gas is significantly more turbulent than the molecular gas, with σ ≈ 300 km s−1 for the ionised gas and σ ≈ 150 km s−1 for the H2, in regions co-spatial with a radio hotspot (Pereira-Santaella et al. 2022). Although the W80 values for H2 are typically lower than those for the ionised gas (Fig. 3), the radial profiles of W80 for H2 and [FeII] show similar trends, with values increasing from the nucleus outward, suggesting that the first interpretation is more likely.
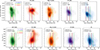 |
Fig. 7. Density plots for [Fe II]λ5.3403 μm/[Ar II]λ6.9853 μm vs H2S(5)/H2S(3) (top) and W80 for the H2 S(5) line vs H2S(5)/H2S(3) (bottom) for all sub-samples. The vertical lines represent the mean H2S(5)/H2S(3) predictions of the shock models from Kristensen et al. (2023) for velocities of 5, 10, 25, and 50 kms−1 (different colours) and densities of nH = 103 (dotted lines) and nH = 106 cm−1 (dashed lines). |
The analysis of emission line ratios, gas kinematics, and comparisons with shock and photoionisation models indicates that shocks driven by outflows and jets are a key factor in producing the [FeII] and H2 emission within the inner few kpc of AGN host galaxies. The [FeII] emission arises from partially ionised zones situated beyond the main hydrogen ionisation front in narrow-line region clouds, forming a transition between fully ionised and neutral gas (Forbes & Ward 1993; Simpson et al. 1996), while the mid-IR, H2 lines trace warm molecular gas at temperatures of a few hundred Kelvin (Pereira-Santaella et al. 2014; Togi & Smith 2016). Our results suggest that turbulence produced in the ISM by outflows and/or radio jets may constitute an important mechanism of maintenance-mode AGN feedback, as it prevents the gas from efficiently cooling and forming stars, thereby regulating star formation.
6. Conclusions
We used archival JWST MIRI/MRS observations of a sample consisting of 54 galaxies at z < 0.1 to investigate the origin of the warm molecular and low-ionisation gas emission. The sample includes SFGs and AGN hosts, with AGNs selected on the basis of their X-ray, radio, and coronal line emissions. We investigate the origin of the emission and turbulence of the gas from flux measurements and velocity dispersion, parameterised by the W80 parameter, for H2 S(5)λ6.9091 μm, [ArII]λ6.9853 μm, [FeII]λ5.3403 μm, [ArIII]λ8.9914 μm, and [MgV]λ5.6098 μm emission lines. Our main conclusions are the following:
-
AGNs exhibit broader emission lines than SFGs, with the largest velocity dispersions observed for radio-strong AGNs. The H2 gas is less turbulent compared to the ionised gas for all the sub-samples studied, followed by [ArII], [ArIII], and [FeII]. Among the galaxies with coronal emission, the coronal gas shows higher velocity dispersion values compared to lower ionisation lines, suggesting stratified emission clouds.
-
The velocity dispersion of molecular and low-ionisation gas increases with distance from the nucleus, particularly for the emission lines of H2 and [FeII], which is contrary to what is expected from gravitationally dominated motions. Additionally, the high values of W80 indicate the presence of outflows in AGN hosts. Meanwhile in SF, the W80 values are lower than those for AGNs, yet they still require an additional component, such as shock-heated gas emission from stellar winds or galaxy interactions.
-
There is a strong correlation between the W80 parameter and the line ratios H2 S(5)λ6.9091 μm [ArII]λ6.9853 μm and [FeII]λ5.3403 μm and [ArII]λ6.9853 μm, as well as between these two ratios themselves. This indicates that the [FeII] and H2 emissions originate from linked physical processes. Since H2 and [FeII] emissions are enhanced in shocked gas, these correlations offer additional evidence that shocks play an important role in the observed emission in our sample.
-
The lowest W80 values (< 300 km s−1) across all samples are associated with SF, presenting line ratios consistent with predictions from SF photoionisation models for gas densities in the range 102–104 cm−3. As gas turbulence increases, the contribution from shocks becomes significant, with [FeII]λ5.3403 μm/[ArII]λ6.9853 μm intensity ratios consistent with predictions from fast shock models, assuming shock velocities in the range of ∼100 to ∼300 km s−1 and gas densities between 103 and 104 cm−3. Some contribution from AGN photoionisation could be important, particularly for the highest [Ar III] λ8.9914 μm/[Ar II] λ6.9853 μm ratios, which are consistent with AGN photoionisation models for gas densities of 102 and 105 cm−3.
-
Although the observed H2 S(5)/H2 S(3) flux line ratios are consistent with predictions from slow shock models, there is no trend between this line ratio and the H2 velocity dispersion and [FeII]λ5.3403 μm/[ArII]λ6.9853 μm. These results, along with the similar trends observed in the gas turbulence for [FeII] and H2, increasing from the nucleus outwards, leads to the interpretation that the H2 emission could be produced by molecules re-forming in the post-shock region.
-
We find similarities in line widths and line ratios between the BAT and [Mg V] AGN sub-samples, consistent with the fact that both are direct tracers of AGN emission, either through the X-rays generated by the central engine or the high-energy photons necessary to ionise the coronal gas. Similarly, among the AGN subsamples, the IR AGN sub-sample shows line widths and ratios that more closely resemble those of the SFGs. This is consistent with many IR AGNs being U/LIRGs that exhibit intense star formation.
Our analysis reveals that high turbulence is a pervasive feature present in all the sub-samples studied. This turbulence, driven by AGN outflows, radio jets or stellar winds, plays a crucial role in influencing the kinematics and physical state of the ISM in these galaxies. The widespread presence of such energetic feedback mechanisms underscores their importance in galaxy evolution, affecting gas dynamics and potentially regulating SF across diverse environments.
Acknowledgments
The authors are grateful to the reviewer for the valuable and very constructive suggestions and comments, which greatly contributed to improving our manuscript. The data were obtained from the Mikulski Archive for Space Telescopes (MAST) at the Space Telescope Science Institute (STScI), which is operated by the Association of Universities for Research in Astronomy, Inc., under NASA contract NAS 5-03127 for JWST. The complete dataset can be accessed at the MAST portal, through the DOI 10.17909/zqhf-wg84. RAR acknowledges the support from Conselho Nacional de Desenvolvimento Científico e Tecnológico (CNPq; Proj. 303450/2022-3, 403398/2023-1, & 441722/2023-7) and Coordenação de Aperfeiçoamento de Pessoal de Nível Superior (CAPES; Proj. 88887.894973/2023-00). LC acknowledges support by grant PIB2021-127718NB-I00 from the Spanish Ministry of Science and Innovation/State Agency of Research MCIN/AEI/10.13039/501100011033 and by “ERDF A way of making Europe”. CRA and AA acknowledge support from the Agencia Estatal de Investigación of the Ministerio de Ciencia, Innovación y Universidades (MCIU/AEI) under the grant “Tracking active galactic nuclei feedback from parsec to kiloparsec scales”, with reference PID2022−141105NB−I00 and the European Regional Development Fund (ERDF). MPS acknowledges support under grants RYC2021-033094-I, CNS2023-145506, and PID2023-146667NB-I00 funded by MCIN/AEI/10.13039/501100011033 and the European Union NextGenerationEU/PRTR. AA acknowledges funding from the European Union grant WIDERA ExGal-Twin, GA 101158446. EB acknowledges support from the Spanish grants PID2022-138621NB-I00 and PID2021-123417OB-I00, funded by MCIN/AEI/10.13039/501100011033/FEDER, EU. FE and SGB acknowledge support from the Spanish grant PID2022-138560NB-I00, funded by MCIN/AEI/10.13039/501100011033/FEDER, EU. AJB acknowledges funding from the “FirstGalaxies” Advanced Grant from the European Research Council (ERC) under the European Union’s Horizon 2020 research and innovation program (Grant agreement No. 789056). AAH and MVM acknowledge support from grant PID2021-124665NB-I00 funded by the Spanish Ministry of Science and Innovation and the State Agency of Research MCIN/AEI/10.13039/501100011033 and ERDF A way of making Europe. EB acknowledges support from the Spanish grants PID2022-138621NB-I00 and PID2021-123417OB-I00, funded by MCIN/AEI/10.13039/501100011033/FEDER, EU. OGM acknowledges financial support from the UNAM PAPIIT project IN109123 and SECIHTI Cienca de Frontera proyect CF-2023-G100. EKSH and LZ acknowledge grant support from the Space Telescope Science Institute (ID: JWST-GO-01670). BGL acknowledges support from the Spanish Ministry of Science and Innovation through the Spanish State Research Agency (AEIMCINN/10.13039/501100011033) through grants “Participation of the Instituto de Astrofísica de Canarias in the development of HARMONI: Delta-D1 phase and rescope study” with references PID2022-140483NB-C21 and PID2024-158231NB-C21. This research has made use of the NASA/IPAC Extragalactic Database (NED), which is operated by the Jet Propulsion Laboratory, California Institute of Technology, under contract with the National Aeronautics and Space Administration. The AI tool ChatGPT (GPT-4.5) was used to assist in debugging the code used to produce the figures and to refine the wording of some sentences in the manuscript. This research made use of Astropy, a community-developed core Python package for Astronomy (Astropy Collaboration 2013, 2022).
References
- Albán, M., Wylezalek, D., Comerford, J. M., Greene, J. E., & Riffel, R. A. 2024, A&A, 691, A124 [NASA ADS] [CrossRef] [EDP Sciences] [Google Scholar]
- Aliste Castillo, R. L. S. E., Lee, Y.-H., Kokusho, T., et al. 2025, AJ, 169, 227 [Google Scholar]
- Allen, M. G., Groves, B. A., Dopita, M. A., Sutherland, R. S., & Kewley, L. J. 2008, ApJS, 178, 20 [Google Scholar]
- Allison, J. R., Sadler, E. M., & Meekin, A. M. 2014, MNRAS, 440, 696 [Google Scholar]
- Alonso Herrero, A., Hermosa Muñoz, L., Labiano, A., et al. 2024, A&A, 690, A95 [NASA ADS] [CrossRef] [EDP Sciences] [Google Scholar]
- Alonso-Herrero, A., García-Burillo, S., Hönig, S. F., et al. 2021, A&A, 652, A99 [NASA ADS] [CrossRef] [EDP Sciences] [Google Scholar]
- Alonso-Herrero, A., Hermosa Muñoz, L., Labiano, A., et al. 2025, ArXiv e-prints [arXiv:2506.15286] [Google Scholar]
- Antonucci, R. 1993, ARA&A, 31, 473 [Google Scholar]
- Appleton, P. N., Guillard, P., Togi, A., et al. 2017, ApJ, 836, 76 [Google Scholar]
- Appleton, P. N., Guillard, P., Emonts, B., et al. 2023, ApJ, 951, 104 [NASA ADS] [CrossRef] [Google Scholar]
- Argyriou, I., Glasse, A., Law, D. R., et al. 2023, A&A, 675, A111 [NASA ADS] [CrossRef] [EDP Sciences] [Google Scholar]
- Armus, L., Mazzarella, J. M., Evans, A. S., et al. 2009, PASP, 121, 559 [Google Scholar]
- Armus, L., Lai, T., U, V., et al. 2023, ApJ, 942, L37 [NASA ADS] [CrossRef] [Google Scholar]
- Arribas, S., Colina, L., Bellocchi, E., Maiolino, R., & Villar-Martín, M. 2014, A&A, 568, A14 [NASA ADS] [CrossRef] [EDP Sciences] [Google Scholar]
- Assef, R. J., Kochanek, C. S., Brodwin, M., et al. 2010, ApJ, 713, 970 [NASA ADS] [CrossRef] [Google Scholar]
- Astropy Collaboration (Robitaille, T. P., et al.) 2013, A&A, 558, A33 [NASA ADS] [CrossRef] [EDP Sciences] [Google Scholar]
- Astropy Collaboration (Price-Whelan, A. M., et al.) 2022, ApJ, 935, 167 [NASA ADS] [CrossRef] [Google Scholar]
- Audibert, A., Ramos Almeida, C., García-Burillo, S., et al. 2023, A&A, 671, L12 [NASA ADS] [CrossRef] [EDP Sciences] [Google Scholar]
- Audibert, A., Ramos Almeida, C., García-Burillo, S., et al. 2025, A&A, 699, A83 [NASA ADS] [CrossRef] [EDP Sciences] [Google Scholar]
- Avery, C. R., Wuyts, S., Förster Schreiber, N. M., et al. 2021, MNRAS, 503, 5134 [NASA ADS] [CrossRef] [Google Scholar]
- Baan, W. A., & Klöckner, H. R. 2006, A&A, 449, 559 [NASA ADS] [CrossRef] [EDP Sciences] [Google Scholar]
- Baldwin, J. A., Phillips, M. M., & Terlevich, R. 1981, PASP, 93, 5 [Google Scholar]
- Becker, R. H., White, R. L., & Edwards, A. L. 1991, ApJS, 75, 1 [Google Scholar]
- Bellocchi, E., Arribas, S., Colina, L., & Miralles-Caballero, D. 2013, A&A, 557, A59 [NASA ADS] [CrossRef] [EDP Sciences] [Google Scholar]
- Bessiere, P. S., & Ramos Almeida, C. 2022, MNRAS, 512, L54 [NASA ADS] [CrossRef] [Google Scholar]
- Bessiere, P. S., Ramos Almeida, C., Holden, L. R., Tadhunter, C. N., & Canalizo, G. 2024, A&A, 689, A271 [NASA ADS] [CrossRef] [EDP Sciences] [Google Scholar]
- Best, P. N., Kauffmann, G., Heckman, T. M., et al. 2005, MNRAS, 362, 25 [Google Scholar]
- Bianchin, M., Riffel, R. A., Storchi-Bergmann, T., et al. 2022, MNRAS, 510, 639 [Google Scholar]
- Biémont, E., Frémat, Y., & Quinet, P. 1999, Atom. Data Nucl. Data Tables, 71, 117 [Google Scholar]
- Bohn, T., Inami, H., Togi, A., et al. 2024, ApJ, 977, 36 [NASA ADS] [CrossRef] [Google Scholar]
- Bottinelli, L., Gouguenheim, L., Paturel, G., & de Vaucouleurs, G. 1984, A&AS, 56, 381 [NASA ADS] [Google Scholar]
- Bressan, A., Fagotto, F., Bertelli, G., & Chiosi, C. 1993, A&AS, 100, 647 [NASA ADS] [Google Scholar]
- Brown, M. J. I., Moustakas, J., Kennicutt, R. C., et al. 2017, ApJ, 847, 136 [Google Scholar]
- Buiten, V. A., van der Werf, P. P., Viti, S., et al. 2024, ApJ, 966, 166 [NASA ADS] [CrossRef] [Google Scholar]
- Bushouse, H., Eisenhamer, J., Dencheva, N., et al. 2024, https://doi.org/10.5281/zenodo.10870758 [Google Scholar]
- Cassanta, C. M., Riffel, R. A., Robinson, A., et al. 2025, MNRAS, 541, 266 [Google Scholar]
- Ceci, M., Marconcini, C., Marconi, A., et al. 2025, A&A, accepted [arXiv:2507.08077] [Google Scholar]
- Chatzikos, M., Bianchi, S., Camilloni, F., et al. 2023, Rev. Mex. Astron. Astrofis., 59, 327 [Google Scholar]
- Cicone, C., Maiolino, R., Sturm, E., et al. 2014, A&A, 562, A21 [NASA ADS] [CrossRef] [EDP Sciences] [Google Scholar]
- Cluver, M. E., Jarrett, T. H., Dale, D. A., et al. 2017, ApJ, 850, 68 [Google Scholar]
- Colina, L., Piqueras López, J., Arribas, S., et al. 2015, A&A, 578, A48 [NASA ADS] [CrossRef] [EDP Sciences] [Google Scholar]
- Condon, J. J., Helou, G., Sanders, D. B., & Soifer, B. T. 1996, ApJS, 103, 81 [CrossRef] [Google Scholar]
- Condon, J. J., Cotton, W. D., Greisen, E. W., et al. 1998, AJ, 115, 1693 [Google Scholar]
- Condon, J. J., Cotton, W. D., & Broderick, J. J. 2002, AJ, 124, 675 [Google Scholar]
- Contini, M., & Viegas, S. M. 2001, ApJS, 132, 211 [NASA ADS] [CrossRef] [Google Scholar]
- Costa-Souza, J. H., Riffel, R. A., Souza-Oliveira, G. L., et al. 2024, ApJ, 974, 127 [Google Scholar]
- Cresci, G., Marconi, A., Zibetti, S., et al. 2015, A&A, 582, A63 [NASA ADS] [CrossRef] [EDP Sciences] [Google Scholar]
- Dalla Vecchia, C., & Schaye, J. 2012, MNRAS, 426, 140 [NASA ADS] [CrossRef] [Google Scholar]
- Dan, K. Y., Seebeck, J., Veilleux, S., et al. 2025, ApJ, 979, 68 [Google Scholar]
- Dasyra, K. M., Paraschos, G. F., Combes, F., et al. 2024, ApJ, 977, 156 [Google Scholar]
- Davies, R. I., Burtscher, L., Rosario, D., et al. 2015, ApJ, 806, 127 [Google Scholar]
- Davies, R., Shimizu, T., Pereira-Santaella, M., et al. 2024, A&A, 689, A263 [NASA ADS] [CrossRef] [EDP Sciences] [Google Scholar]
- Deconto-Machado, A., Riffel, R. A., Ilha, G. S., et al. 2022, A&A, 659, A131 [NASA ADS] [CrossRef] [EDP Sciences] [Google Scholar]
- Delaney, D., Berger, C., Hicks, E., et al. 2025, ApJ, 984, 163 [Google Scholar]
- Di Matteo, T., Springel, V., & Hernquist, L. 2005, Nature, 433, 604 [NASA ADS] [CrossRef] [Google Scholar]
- Done, C., Davis, S. W., Jin, C., Blaes, O., & Ward, M. 2012, MNRAS, 420, 1848 [Google Scholar]
- Dopita, M. A., & Sutherland, R. S. 1995, ApJ, 455, 468 [Google Scholar]
- Dopita, M. A., & Sutherland, R. S. 1996, ApJS, 102, 161 [Google Scholar]
- Dors, O. L., Jr, Riffel, R. A., Cardaci, M. V., et al. 2012, MNRAS, 422, 252 [NASA ADS] [CrossRef] [Google Scholar]
- Dors, O. L., Contini, M., Riffel, R. A., et al. 2021, MNRAS, 501, 1370 [Google Scholar]
- Draine, B. T., Dale, D. A., Bendo, G., et al. 2007, ApJ, 663, 866 [NASA ADS] [CrossRef] [Google Scholar]
- Emonts, B. H. C., Colina, L., Piqueras-López, J., et al. 2017, A&A, 607, A116 [NASA ADS] [CrossRef] [EDP Sciences] [Google Scholar]
- Epinat, B., Amram, P., Balkowski, C., & Marcelin, M. 2010, MNRAS, 401, 2113 [Google Scholar]
- Esposito, F., Alonso-Herrero, A., García-Burillo, S., et al. 2024, A&A, 686, A46 [NASA ADS] [CrossRef] [EDP Sciences] [Google Scholar]
- Evans, A. S., Frayer, D. T., Charmandaris, V., et al. 2022, ApJ, 940, L8 [NASA ADS] [CrossRef] [Google Scholar]
- Ferland, G. J., Chatzikos, M., Guzmán, F., et al. 2017, Rev. Mex. Astron. Astrofis., 53, 385 [NASA ADS] [Google Scholar]
- Fierlinger, K. M., Burkert, A., Ntormousi, E., et al. 2016, MNRAS, 456, 710 [NASA ADS] [CrossRef] [Google Scholar]
- Fischer, T. C., Kraemer, S. B., Schmitt, H. R., et al. 2018, ApJ, 856, 102 [Google Scholar]
- Forbes, D. A., & Ward, M. J. 1993, ApJ, 416, 150 [Google Scholar]
- Förster Schreiber, N. M., Übler, H., Davies, R. L., et al. 2019, ApJ, 875, 21 [Google Scholar]
- Freitas, I. C., Riffel, R. A., Storchi-Bergmann, T., et al. 2018, MNRAS, 476, 2760 [Google Scholar]
- Gallagher, R., Maiolino, R., Belfiore, F., et al. 2019, MNRAS, 485, 3409 [NASA ADS] [CrossRef] [Google Scholar]
- García-Bernete, I., Alonso-Herrero, A., García-Burillo, S., et al. 2021, A&A, 645, A21 [EDP Sciences] [Google Scholar]
- García-Bernete, I., Alonso-Herrero, A., Rigopoulou, D., et al. 2024a, A&A, 681, L7 [NASA ADS] [CrossRef] [EDP Sciences] [Google Scholar]
- García-Bernete, I., Rigopoulou, D., Donnan, F. R., et al. 2024b, A&A, 691, A162 [NASA ADS] [CrossRef] [EDP Sciences] [Google Scholar]
- García-Bernete, I., Donnan, F. R., Rigopoulou, D., et al. 2025, A&A, 696, A135 [NASA ADS] [CrossRef] [EDP Sciences] [Google Scholar]
- García-Burillo, S., Alonso-Herrero, A., Ramos Almeida, C., et al. 2021, A&A, 652, A98 [NASA ADS] [CrossRef] [Google Scholar]
- Gardner, J. P., Mather, J. C., Abbott, R., et al. 2023, PASP, 135, 068001 [NASA ADS] [CrossRef] [Google Scholar]
- Gatto, L., Storchi-Bergmann, T., Riffel, R. A., et al. 2024, MNRAS, 530, 3059 [NASA ADS] [CrossRef] [Google Scholar]
- Gerke, J. R., Kochanek, C. S., Prieto, J. L., Stanek, K. Z., & Macri, L. M. 2011, ApJ, 743, 176 [NASA ADS] [CrossRef] [Google Scholar]
- Godard, B., des Forêts, G. P., & Bialy, S. 2024, A&A, 688, A169 [NASA ADS] [CrossRef] [EDP Sciences] [Google Scholar]
- Gordon, K. D., Clayton, G. C., Decleir, M., et al. 2023, ApJ, 950, 86 [CrossRef] [Google Scholar]
- Gregory, P. C., & Condon, J. J. 1991, ApJS, 75, 1011 [Google Scholar]
- Gregory, P. C., Scott, W. K., Douglas, K., & Condon, J. J. 1996, ApJS, 103, 427 [NASA ADS] [CrossRef] [Google Scholar]
- Grevesse, N., Asplund, M., Sauval, A. J., & Scott, P. 2010, Ap&SS, 328, 179 [Google Scholar]
- Griffith, M. R., Wright, A. E., Burke, B. F., & Ekers, R. D. 1994, ApJS, 90, 179 [NASA ADS] [CrossRef] [Google Scholar]
- Guillard, P., Boulanger, F., Pineau Des Forêts, G., & Appleton, P. N. 2009, A&A, 502, 515 [NASA ADS] [CrossRef] [EDP Sciences] [Google Scholar]
- Harrison, C. M. 2017, Nat. Astron., 1, 0165 [NASA ADS] [CrossRef] [Google Scholar]
- Harrison, C. M., & Ramos Almeida, C. 2024, Galaxies, 12, 17 [NASA ADS] [CrossRef] [Google Scholar]
- Hashimoto, T., Nagao, T., Yanagisawa, K., Matsuoka, K., & Araki, N. 2011, PASJ, 63, L7 [Google Scholar]
- Heckman, T. M., & Best, P. N. 2014, ARA&A, 52, 589 [Google Scholar]
- Hermosa Muñoz, L., Alonso-Herrero, A., Pereira-Santaella, M., et al. 2024, A&A, 690, A350 [NASA ADS] [CrossRef] [EDP Sciences] [Google Scholar]
- Hermosa Muñoz, L., Alonso-Herrero, A., Labiano, A., et al. 2025, A&A, 693, A321 [NASA ADS] [CrossRef] [EDP Sciences] [Google Scholar]
- Hill, M. J., & Zakamska, N. L. 2014, MNRAS, 439, 2701 [Google Scholar]
- Hoffmann, S. L., & Macri, L. M. 2015, AJ, 149, 183 [NASA ADS] [CrossRef] [Google Scholar]
- Hollenbach, D., & McKee, C. F. 1989, ApJ, 342, 306 [Google Scholar]
- Hopkins, P. F., Quataert, E., & Murray, N. 2012, MNRAS, 421, 3522 [Google Scholar]
- Izotov, Y. I., Stasińska, G., Meynet, G., Guseva, N. G., & Thuan, T. X. 2006, A&A, 448, 955 [CrossRef] [EDP Sciences] [Google Scholar]
- Jarrett, T. H., Cohen, M., Masci, F., et al. 2011, ApJ, 735, 112 [Google Scholar]
- Jin, C., Ward, M., & Done, C. 2012, MNRAS, 425, 907 [NASA ADS] [CrossRef] [Google Scholar]
- Jones, O. C., Álvarez-Márquez, J., Sloan, G. C., et al. 2023, MNRAS, 523, 2519 [Google Scholar]
- Jose, C., Chamandy, L., Shukurov, A., et al. 2024, MNRAS, 532, 1504 [Google Scholar]
- Kakkad, D., Sani, E., Rojas, A. F., et al. 2022, MNRAS, 511, 2105 [NASA ADS] [CrossRef] [Google Scholar]
- Karachentsev, I. D., Karachentseva, V. E., & Nasonova, O. G. 2014, Astrophysics, 57, 457 [Google Scholar]
- Kaufman, V., & Whaling, W. 1996, J. Res. Natl. Inst. Stand. Technol., 101, 691 [Google Scholar]
- Kellermann, K. I., Sramek, R., Schmidt, M., Shaffer, D. B., & Green, R. 1989, AJ, 98, 1195 [Google Scholar]
- King, A., & Pounds, K. 2015, ARA&A, 53, 115 [NASA ADS] [CrossRef] [Google Scholar]
- Kramida, A., Ralchenko, Y., & Reader, J. 2014, APS Meeting Abstr., 2014, D1.047 [Google Scholar]
- Kristensen, L. E., Godard, B., Guillard, P., Gusdorf, A., & Pineau des Forêts, G. 2023, A&A, 675, A86 [NASA ADS] [CrossRef] [EDP Sciences] [Google Scholar]
- Kroupa, P. 2002, Science, 295, 82 [Google Scholar]
- Kukreti, P., Wylezalek, D., Albán, M., & Dall’Agnol de Oliveira, B. 2025, A&A, 698, A99 [NASA ADS] [CrossRef] [EDP Sciences] [Google Scholar]
- Labiano, A., Argyriou, I., Álvarez-Márquez, J., et al. 2021, A&A, 656, A57 [NASA ADS] [CrossRef] [EDP Sciences] [Google Scholar]
- Law, D. R., Morrison, Jr., E., Argyriou, I., et al. 2023, AJ, 166, 45 [NASA ADS] [CrossRef] [Google Scholar]
- Leftley, J. H., Nesvadba, N. P. H., Bicknell, G. V., et al. 2024, A&A, 689, A314 [NASA ADS] [CrossRef] [EDP Sciences] [Google Scholar]
- Leitherer, C., Schaerer, D., Goldader, J. D., et al. 1999, ApJS, 123, 3 [Google Scholar]
- Maiolino, R., Russell, H. R., Fabian, A. C., et al. 2017, Nature, 544, 202 [Google Scholar]
- Majaess, D. J., Turner, D. G., & Lane, D. J. 2008, MNRAS, 390, 1539 [NASA ADS] [Google Scholar]
- Marconcini, C., Marconi, A., Cresci, G., et al. 2023, A&A, 677, A58 [NASA ADS] [CrossRef] [EDP Sciences] [Google Scholar]
- Marconcini, C., Feltre, A., Lamperti, I., et al. 2025a, A&A, 701, A113 [NASA ADS] [CrossRef] [EDP Sciences] [Google Scholar]
- Marconcini, C., Marconi, A., Cresci, G., et al. 2025a, Nat. Astron. [arXiv:2503.24359] [Google Scholar]
- Mouri, H., Kawara, K., & Taniguchi, Y. 2000, ApJ, 528, 186 [Google Scholar]
- Mullaney, J. R., Alexander, D. M., Fine, S., et al. 2013, MNRAS, 433, 622 [Google Scholar]
- Nagar, N. M., Falcke, H., & Wilson, A. S. 2005, A&A, 435, 521 [NASA ADS] [CrossRef] [EDP Sciences] [Google Scholar]
- Nasonova, O. G., de Freitas Pacheco, J. A., & Karachentsev, I. D. 2011, A&A, 532, A104 [NASA ADS] [CrossRef] [EDP Sciences] [Google Scholar]
- Nave, G., & Johansson, S. 2013, ApJS, 204, 1 [NASA ADS] [CrossRef] [Google Scholar]
- Negus, J., Comerford, J. M., Sánchez, F. M., et al. 2023, ApJ, 945, 127 [NASA ADS] [CrossRef] [Google Scholar]
- Netzer, H. 2015, ARA&A, 53, 365 [Google Scholar]
- Ogle, P., Boulanger, F., Guillard, P., et al. 2010, ApJ, 724, 1193 [NASA ADS] [CrossRef] [Google Scholar]
- Ogle, P. M., Sebastian, B., Aravindan, A., et al. 2025, ArXiv e-prints [arXiv:2502.06603] [Google Scholar]
- Oh, K., Koss, M., Markwardt, C. B., et al. 2018, ApJS, 235, 4 [Google Scholar]
- Ohyama, Y., Terashima, Y., & Sakamoto, K. 2015, ApJ, 805, 162 [Google Scholar]
- Oldham, L. J., & Auger, M. W. 2016, MNRAS, 455, 820 [NASA ADS] [CrossRef] [Google Scholar]
- Oliva, E., Marconi, A., Maiolino, R., et al. 2001, A&A, 369, L5 [NASA ADS] [CrossRef] [EDP Sciences] [Google Scholar]
- Orienti, M., & Prieto, M. A. 2010, MNRAS, 401, 2599 [NASA ADS] [CrossRef] [Google Scholar]
- Padovani, P. 2017, Front. Astron. Space Sci., 4, 35 [CrossRef] [Google Scholar]
- Pereira-Santaella, M., Spinoglio, L., van der Werf, P. P., & Piqueras López, J. 2014, A&A, 566, A49 [NASA ADS] [CrossRef] [EDP Sciences] [Google Scholar]
- Pereira-Santaella, M., Álvarez-Márquez, J., García-Bernete, I., et al. 2022, A&A, 665, L11 [NASA ADS] [CrossRef] [EDP Sciences] [Google Scholar]
- Pereira-Santaella, M., García-Bernete, I., González-Alfonso, E., et al. 2024, A&A, 685, L13 [NASA ADS] [CrossRef] [EDP Sciences] [Google Scholar]
- Perna, M., Arribas, S., Colina, L., et al. 2022, A&A, 662, A94 [NASA ADS] [CrossRef] [EDP Sciences] [Google Scholar]
- Piqueras López, J., Colina, L., Arribas, S., Alonso-Herrero, A., & Bedregal, A. G. 2012, A&A, 546, A64 [NASA ADS] [CrossRef] [EDP Sciences] [Google Scholar]
- Radburn-Smith, D. J., de Jong, R. S., Seth, A. C., et al. 2011, ApJS, 195, 18 [Google Scholar]
- Radcliffe, J. F., Barthel, P. D., Thomson, A. P., et al. 2021, A&A, 649, A27 [EDP Sciences] [Google Scholar]
- Ramos Almeida, C., Piqueras López, J., Villar-Martín, M., & Bessiere, P. S. 2017, MNRAS, 470, 964 [NASA ADS] [CrossRef] [Google Scholar]
- Ramos Almeida, C., Acosta-Pulido, J. A., Tadhunter, C. N., et al. 2019, MNRAS, 487, L18 [NASA ADS] [CrossRef] [Google Scholar]
- Ramos Almeida, C., García-Bernete, I., Pereira-Santaella, M., et al. 2025, A&A, 698, A194 [NASA ADS] [CrossRef] [EDP Sciences] [Google Scholar]
- Rest, A., Scolnic, D., Foley, R. J., et al. 2014, ApJ, 795, 44 [Google Scholar]
- Ricci, T. V., Steiner, J. E., May, D., Garcia-Rissmann, A., & Menezes, R. B. 2018, MNRAS, 473, 5334 [NASA ADS] [CrossRef] [Google Scholar]
- Richings, A. J., & Faucher-Giguère, C.-A. 2018a, MNRAS, 474, 3673 [Google Scholar]
- Richings, A. J., & Faucher-Giguère, C.-A. 2018b, MNRAS, 478, 3100 [NASA ADS] [CrossRef] [Google Scholar]
- Riess, A. G., Macri, L. M., Hoffmann, S. L., et al. 2016, ApJ, 826, 56 [Google Scholar]
- Riffel, R. A., Bianchin, M., Riffel, R., et al. 2021a, MNRAS, 503, 5161 [NASA ADS] [CrossRef] [Google Scholar]
- Riffel, R. A., Dors, O. L., Armah, M., et al. 2021b, MNRAS, 501, L54 [Google Scholar]
- Riffel, R. A., Storchi-Bergmann, T., Riffel, R., et al. 2021c, MNRAS, 504, 3265 [NASA ADS] [CrossRef] [Google Scholar]
- Riffel, R. A., Storchi-Bergmann, T., Riffel, R., et al. 2023, MNRAS, 521, 1832 [NASA ADS] [CrossRef] [Google Scholar]
- Riffel, R. A., Souza-Oliveira, G. L., Costa-Souza, J. H., et al. 2025, ApJ, 982, 69 [Google Scholar]
- Rodríguez-Ardila, A., & Cerqueira-Campos, F. 2025, Front. Astron. Space Sci., 12, 1548632 [Google Scholar]
- Rodríguez-Ardila, A., Fonseca-Faria, M. A., Dahmer-Hahn, L. G., et al. 2025, MNRAS, 538, 2800 [Google Scholar]
- Ruschel-Dutra, D., Storchi-Bergmann, T., Schnorr-Müller, A., et al. 2021, MNRAS, 507, 74 [NASA ADS] [CrossRef] [Google Scholar]
- Sabbi, E., Calzetti, D., Ubeda, L., et al. 2018, ApJS, 235, 23 [Google Scholar]
- Sajina, A., Partridge, B., Evans, T., et al. 2011, ApJ, 732, 45 [Google Scholar]
- Sansonetti, J. E., & Martin, W. C. 2005, J. Phys. Chem. Ref. Data, 34, 1559 [NASA ADS] [CrossRef] [Google Scholar]
- Schönell, A. J., Jr, Riffel, R. A., Riffel, R., & Storchi-Bergmann, T. 2025, MNRAS, 537, 3826 [Google Scholar]
- Silk, J. 2013, ApJ, 772, 112 [Google Scholar]
- Silk, J., & Rees, M. J. 1998, A&A, 331, L1 [NASA ADS] [Google Scholar]
- Silk, J., Begelman, M. C., Norman, C., Nusser, A., & Wyse, R. F. G. 2024, ApJ, 961, L39 [NASA ADS] [CrossRef] [Google Scholar]
- Simpson, C., Forbes, D. A., Baker, A. C., & Ward, M. J. 1996, MNRAS, 283, 777 [Google Scholar]
- Skrutskie, M. F., Cutri, R. M., Stiening, R., et al. 2006, AJ, 131, 1163 [NASA ADS] [CrossRef] [Google Scholar]
- Speranza, G., Ramos Almeida, C., Acosta-Pulido, J. A., et al. 2024, A&A, 681, A63 [NASA ADS] [CrossRef] [EDP Sciences] [Google Scholar]
- Spitler, L. R., Larsen, S. S., Strader, J., et al. 2006, AJ, 132, 1593 [Google Scholar]
- Steenbrugge, K. C., Heywood, I., & Blundell, K. M. 2010, MNRAS, 401, 67 [NASA ADS] [CrossRef] [Google Scholar]
- Stern, D., Assef, R. J., Benford, D. J., et al. 2012, ApJ, 753, 30 [Google Scholar]
- Stil, J. M., Krause, M., Beck, R., & Taylor, A. R. 2009, ApJ, 693, 1392 [Google Scholar]
- Su, R., Mahony, E. K., Gu, M., et al. 2023, MNRAS, 520, 5712 [Google Scholar]
- Sutherland, R. S., & Dopita, M. A. 2017, ApJS, 229, 34 [Google Scholar]
- Tadhunter, C. 2016, A&ARv, 24, 10 [Google Scholar]
- Tingay, S. J., Jauncey, D. L., King, E. A., et al. 2003, PASJ, 55, 351 [NASA ADS] [Google Scholar]
- Togi, A., & Smith, J. D. T. 2016, ApJ, 830, 18 [NASA ADS] [CrossRef] [Google Scholar]
- Tully, R. B., Courtois, H. M., Dolphin, A. E., et al. 2013, AJ, 146, 86 [NASA ADS] [CrossRef] [Google Scholar]
- Tully, R. B., Courtois, H. M., & Sorce, J. G. 2016, AJ, 152, 50 [Google Scholar]
- U, V., Lai, T., Bianchin, M., et al. 2022, ApJ, 940, L5 [NASA ADS] [CrossRef] [Google Scholar]
- Veilleux, S., Maiolino, R., Bolatto, A. D., & Aalto, S. 2020, A&ARv, 28, 2 [NASA ADS] [CrossRef] [Google Scholar]
- Venturi, G., Cresci, G., Marconi, A., et al. 2021, A&A, 648, A17 [NASA ADS] [CrossRef] [EDP Sciences] [Google Scholar]
- Villar Martín, M., Castro-Rodríguez, N., Pereira Santaella, M., et al. 2023, A&A, 673, A25 [NASA ADS] [CrossRef] [EDP Sciences] [Google Scholar]
- Wells, M., Pel, J. W., Glasse, A., et al. 2015, PASP, 127, 646 [NASA ADS] [CrossRef] [Google Scholar]
- Willick, J. A., Courteau, S., Faber, S. M., et al. 1997, ApJS, 109, 333 [NASA ADS] [CrossRef] [Google Scholar]
- Wright, A. E., Griffith, M. R., Burke, B. F., & Ekers, R. D. 1994, ApJS, 91, 111 [Google Scholar]
- Wright, E. L., Eisenhardt, P. R. M., Mainzer, A. K., et al. 2010, AJ, 140, 1868 [Google Scholar]
- Wright, G. S., Wright, D., Goodson, G. B., et al. 2015, PASP, 127, 595 [NASA ADS] [CrossRef] [Google Scholar]
- Wright, G. S., Rieke, G. H., Glasse, A., et al. 2023, PASP, 135, 048003 [NASA ADS] [CrossRef] [Google Scholar]
- Wylezalek, D., Flores, A. M., Zakamska, N. L., Greene, J. E., & Riffel, R. A. 2020, MNRAS, 492, 4680 [NASA ADS] [CrossRef] [Google Scholar]
- Zakamska, N. L. 2010, Nature, 465, 60 [NASA ADS] [CrossRef] [Google Scholar]
- Zakamska, N. L., Lampayan, K., Petric, A., et al. 2016, MNRAS, 455, 4191 [Google Scholar]
- Zanchettin, M. V., Massardi, M., Salvestrini, F., et al. 2024, ApJ, 970, 75 [NASA ADS] [CrossRef] [Google Scholar]
- Zanchettin, M. V., Ramos Almeida, C., Audibert, A., et al. 2025, A&A, 695, A185 [NASA ADS] [CrossRef] [EDP Sciences] [Google Scholar]
- Zhang, L., Packham, C., Hicks, E. K. S., et al. 2024, ApJ, 974, 195 [NASA ADS] [CrossRef] [Google Scholar]
- Zubovas, K., & King, A. R. 2014, MNRAS, 439, 400 [Google Scholar]
Appendix A: Observational proposals
Our sample consists of 54 galaxies, listed in Table A.1, along with details of the observational proposals. Our sample includes representatives from the The Great Observatories All-Sky LIRG Survey (GOALS; e.g. Armus et al. 2009; U et al. 2022; Evans et al. 2022; Buiten et al. 2024), The Galaxy Activity, Torus, and Outflow Survey (GATOS; e.g. García-Burillo et al. 2021; Alonso-Herrero et al. 2021; Davies et al. 2024; García-Bernete et al. 2024a), Mid-IR Characterisation Of Nearby Iconic galaxy Centers (MICONIC; e.g. Alonso Herrero et al. 2024; Alonso-Herrero et al. 2025; Hermosa Muñoz et al. 2025), Mid-InfraRed Activity of Circumnuclear Line Emission (MIRACLE; e.g. Marconcini et al. 2025a; Ceci et al. 2025) projects, among others.
Sample.
As described in Sec. 2, we have defined four AGN and SFG subsamples, which may overlap. Fig A.1 presents a Venn diagram illustrating the intersections among the different AGN subsamples.
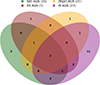 |
Fig. A.1. Venn diagram illustrating the overlap among the different AGN subsamples. |
Appendix B: [MgV] flux distributions
In Fig. A.2, we present the flux maps for all galaxies with [MgV]λ5.6098 μm emission detected in individual spaxels at a confidence level greater than 5 sigma, along with integrated line profiles considering all spaxels with detected emission. The sample galaxies exhibit diverse flux distributions, ranging from highly collimated structures to more rounded shapes. The discussion on the origin of coronal lines in this sample is beyond the scope of this paper, as we use them solely as a selection criterion. Detailed results on some individual objects, including the analysis of coronal line emission, have already been published on the basis of MIRI MRS data (e.g. Armus et al. 2023; Hermosa Muñoz et al. 2024, 2025; Zhang et al. 2024, among others).
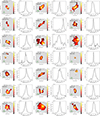 |
Fig. B.1. [MgV]λ5.6098 μm flux distributions for galaxies with coronal line emission in our sample. The maps illustrate the flux distributions, with gray regions indicating areas where the corresponding emission line is not detected at s/n > 5. The plots display the [MgV]λ5.6098 μm integrated profiles, obtained by summing the observed profiles across all detected spaxels and subtracting the continuum. The name of each galaxy is shown in the top-left corner of each plot, the spatial scale is shown in the bottom-left corner, and the central cross marks the position of the galaxy’s nucleus. |
Appendix C: W80 radial profiles per sub-sample
Figure C.1 presents the W80 radial profiles grouping the four emission lines for each sub-sample, providing a clearer comparison of the differences observed among the distinct emission lines. For the [MgV] AGN sample (bottom panel) we include also the [MgV]λ5.6098 μm W80 values. For the SF sample, the nuclear W80 values are typically below 300 kms−1, reaching maximum values of ∼450 kms−1 farther from the nucleus. The [ArIII] emission line is detected at radii larger than 1 kpc only for two objects in the SF sample (IRAS10565+2448 and IRAS23128-5919), which have higher W80 values resulting in the increased values at these distances. For the AGN samples, the lowest W80 values are typically observed for H2 and [ArII], which show similar values, while the highest values are found for [FeII] and [ArIII]. Among AGNs with coronal emission, within the inner ∼1 kpc, the highest W80 values are observed for [MgV]. At larger distances, however, the coronal gas shows velocity dispersion similar to that of the other ionised gas lines.
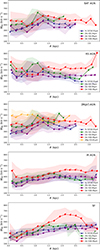 |
Fig. C.1. W80 radial profiles for the four emission lines given for the BAT AGN, RS AGN, [MgV] AGN, IR AGN, and SF sub-samples, from top to bottom. These profiles were computed following the same methodology as those shown in Fig. 4. |
Appendix D: Shock and photoionisation models
D.1. Shock models
In this work, we use the fast shock models from Pereira-Santaella et al. (2024). These models were computed with the MAPPINGS V code (Dopita & Sutherland 1996; Sutherland & Dopita 2017) and are designed to investigate the origin of ionised gas emission lines in nearby galaxies observed with MIRI/MRS. They follow the prescription of Sutherland & Dopita (2017), varying several parameters: the gas metallicity (Zgas), the shock velocity (vs), and defining a ram pressure variable as  , where nH is the gas volume density, and the magnetic-to-ram pressure ratio
  , where B is the magnetic field and ρ the gas density. In this work we adopt models with solar metallicity, shock velocities in the range 80–500 km s−1, and ram pressure parameters RP = 106 and 108. Further details on the shock models are given in Pereira-Santaella et al. (2024).
D.2. AGN and SF photoionisation models
We used CLOUDY code version c23.01 (Ferland et al. 2017; Chatzikos et al. 2023) to construct grids of photoionisation models for AGN and SF, following procedures similar to those described by Pereira-Santaella et al. (2024) and Dors et al. (2012).
For the AGN models, we adopt the ionising Spectral Energy Distribution (SED) from Jin et al. (2012), based on the OPTXAGNF model (Done et al. 2012). This model describes accretion disk emission with three components powered by a single mass accretion flow: a multi-colour blackbody disk producing optical/UV emission, a warm corona generating soft X-rays via Comptonisation, and a hot corona responsible for hard X-rays. It is particularly suited for AGN with low Eddington ratios and is included in the CLOUDY SED library.
For the SF models, we generated the SEDs using the STARBURST99 code (Leitherer et al. 1999), adopting an instantaneous SF mode. We assume a Kroupa initial mass function (IMF) (Kroupa 2002), with a slope of α = 1.3 for masses between 0.1 and 0.5 M⊙, and α = 2.3 for masses from 0.5 to 100 M⊙. We use the Padova evolutionary tracks with solar metallicity (Bressan et al. 1993). The geometry is assumed to be plane-parallel, and the ionisation parameter (U) is used to scale the source intensity. We used the SEDs output by the STARBURST99 code for ages ranging from 1 to 10 Myr, in 1 Myr increments, to construct the photoionisation models with CLOUDY.
For both AGN and SF models, we adopted solar abundances for all elements based on Grevesse et al. (2010), with an oxygen abundance of 12 + log(O/H) = 8.69. The only exception is iron, which is known to exhibit significant scatter at a fixed O/H value (Izotov et al. 2006). Therefore, we estimate the iron abundance using the relation between iron and oxygen abundances presented by Izotov et al. (2006), resulting in log(Fe/H)≈ − 5.60 for solar oxygen abundance, which is adopted in our models. We adopted grain abundances based on the Orion Nebula, but scaled the PAH abundance to match the range observed in local galaxies, as reported by Draine et al. (2007).
We computed a sequence of models with densities spanning 2 ≤ log nH/cm−3 ≤ 6 and ionisation parameters covering −4.0 ≤ log U ≤ −1.0, both sampled in increments of 1 dex. The models were stopped once the gas temperature fell below 4000 K, the default stopping criterion in CLOUDY. This implies that our models do not predict the H2 emission lines, which are produced at lower temperatures. The stopping criterion is necessary to obtain robust predictions for the ionised gas emission lines, avoiding the complex physics of the transition regions to neutral and molecular gas. Moreover, CLOUDY assumes a simplified one-dimensional structure for AGNs, with a central point-like ionising source and gas in static layers, which is sufficient for modeling the ionised gas emission; however, this does not capture the detailed three-dimensional geometry or the physical conditions in the colder molecular gas regions.
All Tables
Mean properties for each sub-sample. Uncertainties are the standard deviation of each parameter.
All Figures
|
Fig. 1. WISE colour–colour diagram showing the five subsamples, as indicated by the symbols. The uncertainties are comparable to the symbol sizes. The large symbols with error bars correspond to the mean values for each sub-sample, with the error bars representing the standard deviation. The dashed line represents the threshold W1 − W2 = 0.8, while the dotted polygon marks the region typically occupied by Seyfert galaxies (Jarrett et al. 2011). |
| In the text | |
|
Fig. 2. Examples of flux (top panels) and W80 (bottom panels) maps for Arp 220. From left to right, the H2 S(5)λ6.9091 μm, [ArII]λ6.9853 μm, [FeII]λ5.3403 μm, and [ArIII]λ8.9914 μm. The central crosses identify the location of the peak of the continuum, corresponting to the western nucleus, used as reference to calculate radial distances from the galaxy nucleus. The gray regions correspond to locations where the corresponding emission line is not detected with a signal-to-noise ratio of s/n > 5 and regions not covered by the MRS FoV. |
| In the text | |
|
Fig. 3. Nuclear W80 values for the H2 S(5), [Fe II], [Ar II], and [Ar III] emission lines are ordered by increasing ionisation potential from top to bottom, shown for the five subsamples, displayed in separate columns. The W80 values are estimated as the flux weighted mean W80 values of spaxels within a radius of 0.5 arcsec centered at the peak or the continuum emission. The mean values (vertical dotted lines), standard error, and the number of galaxies are displayed in each panel. |
| In the text | |
|
Fig. 4. Radial W80 profiles for H2 (top-left), [FeII] (top-right), [ArII] (bottom-left), and [ArIII] (bottom-right) for the five subsamples, as indicated by the different colours. These profiles are computed as median values of W80 and distance of the spaxel from the position of the continuum peak, within circular rings of 250 pc width. The numbers next to each point indicate the number of galaxies used to compute it, and the shaded regions represent the range between the 25th and 75th percentiles of the W80 values within each radial bin, illustrating the spread of values observed in each emission line. |
| In the text | |
|
Fig. 5. Density maps of W80 for [Fe II] λ 5.3403 μm emission line as a function of the flux ratios: H2 S(5) λ 6.9091 μm/[Ar II] λ 6.9853 μm (top panels), [Fe II] λ 5.3403 μm/[Ar II] λ 6.9853 μm (middle panels), and [Ar III] λ 8.9914 μm/[Ar II] λ 6.9853 μm (bottom panels). The contours are spaced at intervals of 10% in data density. Results are shown for the different subsamples, as identified in the title of each panel. |
| In the text | |
|
Fig. 6. Density plots for the [Fe II]λ5.3403 μm/[Ar II]λ6.9853 μm versus H2 S(5)/[Ar II]λ6.9853 μm (top panels) and [Fe II]λ5.3403 μm/[Ar II]λ6.9853 μm versus [Ar III]λ8.9914 μm/[Ar II]λ6.9853 μm (bottom panels). The dark red lines (bottom-right panel) show predictions from photoionisation models of star-forming regions, assuming stellar clusters aged 6 and 7 Myr. Solid lines indicate different gas densities, dotted lines correspond to varying ionisation parameters (as labelled in the figure), and the predictions for both cluster ages are connected by dashed lines. Similarly, results from AGN photoionisation models are shown as dark blue lines (bottom-central panel). The gray lines and filled circles (bottom-left panel) are predictions of fast shock models from Pereira-Santaella et al. (2024) using the MAPPINGS V code (Sutherland & Dopita 2017) for log RP = 6 (dashed) and log RP = 8 (continuous). The numbers indicate the shock velocities in kms−1. |
| In the text | |
|
Fig. 7. Density plots for [Fe II]λ5.3403 μm/[Ar II]λ6.9853 μm vs H2S(5)/H2S(3) (top) and W80 for the H2 S(5) line vs H2S(5)/H2S(3) (bottom) for all sub-samples. The vertical lines represent the mean H2S(5)/H2S(3) predictions of the shock models from Kristensen et al. (2023) for velocities of 5, 10, 25, and 50 kms−1 (different colours) and densities of nH = 103 (dotted lines) and nH = 106 cm−1 (dashed lines). |
| In the text | |
|
Fig. A.1. Venn diagram illustrating the overlap among the different AGN subsamples. |
| In the text | |
|
Fig. B.1. [MgV]λ5.6098 μm flux distributions for galaxies with coronal line emission in our sample. The maps illustrate the flux distributions, with gray regions indicating areas where the corresponding emission line is not detected at s/n > 5. The plots display the [MgV]λ5.6098 μm integrated profiles, obtained by summing the observed profiles across all detected spaxels and subtracting the continuum. The name of each galaxy is shown in the top-left corner of each plot, the spatial scale is shown in the bottom-left corner, and the central cross marks the position of the galaxy’s nucleus. |
| In the text | |
|
Fig. C.1. W80 radial profiles for the four emission lines given for the BAT AGN, RS AGN, [MgV] AGN, IR AGN, and SF sub-samples, from top to bottom. These profiles were computed following the same methodology as those shown in Fig. 4. |
| In the text | |
Current usage metrics show cumulative count of Article Views (full-text article views including HTML views, PDF and ePub downloads, according to the available data) and Abstracts Views on Vision4Press platform.
Data correspond to usage on the plateform after 2015. The current usage metrics is available 48-96 hours after online publication and is updated daily on week days.
Initial download of the metrics may take a while.