Fig. 2.
Download original image
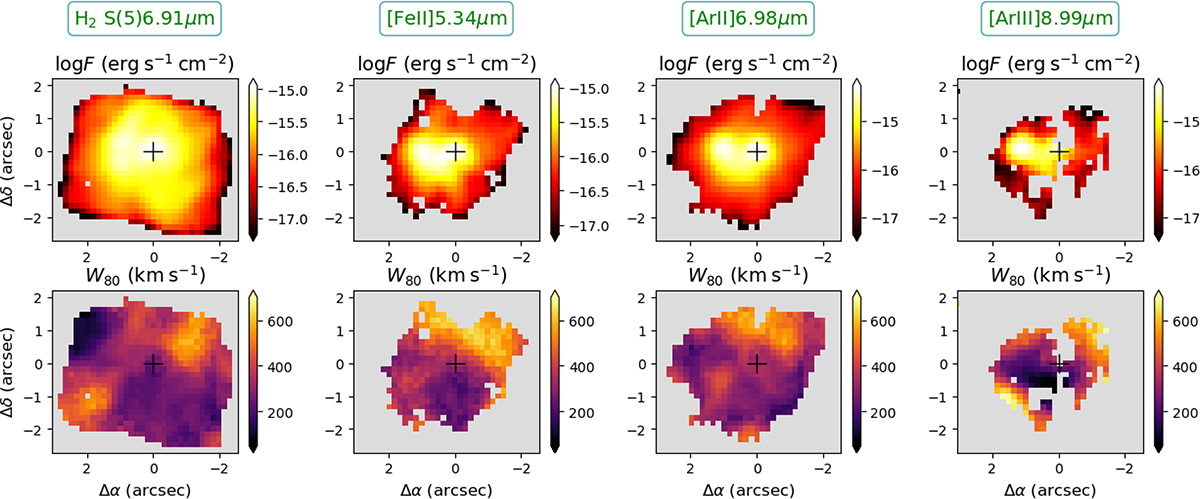
Examples of flux (top panels) and W80 (bottom panels) maps for Arp 220. From left to right, the H2 S(5)λ6.9091 μm, [ArII]λ6.9853 μm, [FeII]λ5.3403 μm, and [ArIII]λ8.9914 μm. The central crosses identify the location of the peak of the continuum, corresponting to the western nucleus, used as reference to calculate radial distances from the galaxy nucleus. The gray regions correspond to locations where the corresponding emission line is not detected with a signal-to-noise ratio of s/n > 5 and regions not covered by the MRS FoV.
Current usage metrics show cumulative count of Article Views (full-text article views including HTML views, PDF and ePub downloads, according to the available data) and Abstracts Views on Vision4Press platform.
Data correspond to usage on the plateform after 2015. The current usage metrics is available 48-96 hours after online publication and is updated daily on week days.
Initial download of the metrics may take a while.