Fig. 3.
Download original image
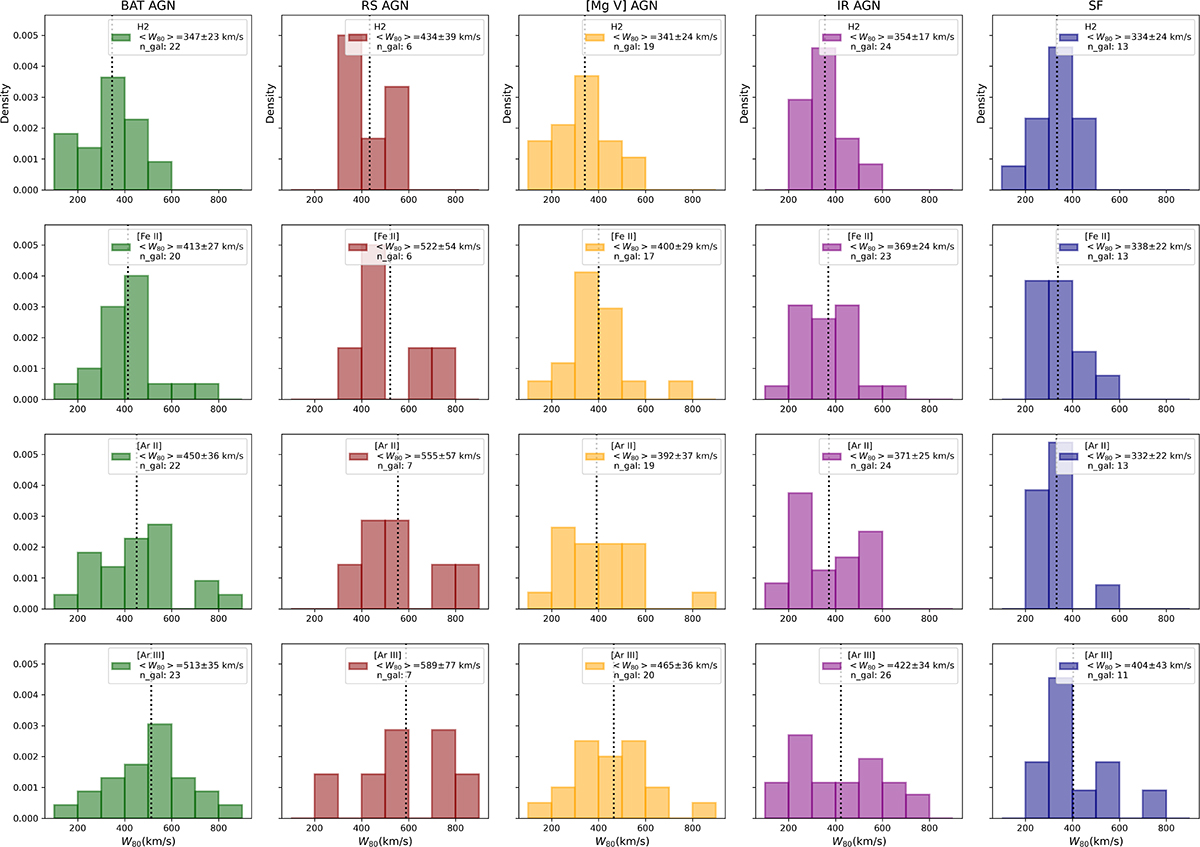
Nuclear W80 values for the H2 S(5), [Fe II], [Ar II], and [Ar III] emission lines are ordered by increasing ionisation potential from top to bottom, shown for the five subsamples, displayed in separate columns. The W80 values are estimated as the flux weighted mean W80 values of spaxels within a radius of 0.5 arcsec centered at the peak or the continuum emission. The mean values (vertical dotted lines), standard error, and the number of galaxies are displayed in each panel.
Current usage metrics show cumulative count of Article Views (full-text article views including HTML views, PDF and ePub downloads, according to the available data) and Abstracts Views on Vision4Press platform.
Data correspond to usage on the plateform after 2015. The current usage metrics is available 48-96 hours after online publication and is updated daily on week days.
Initial download of the metrics may take a while.