Fig. 4.
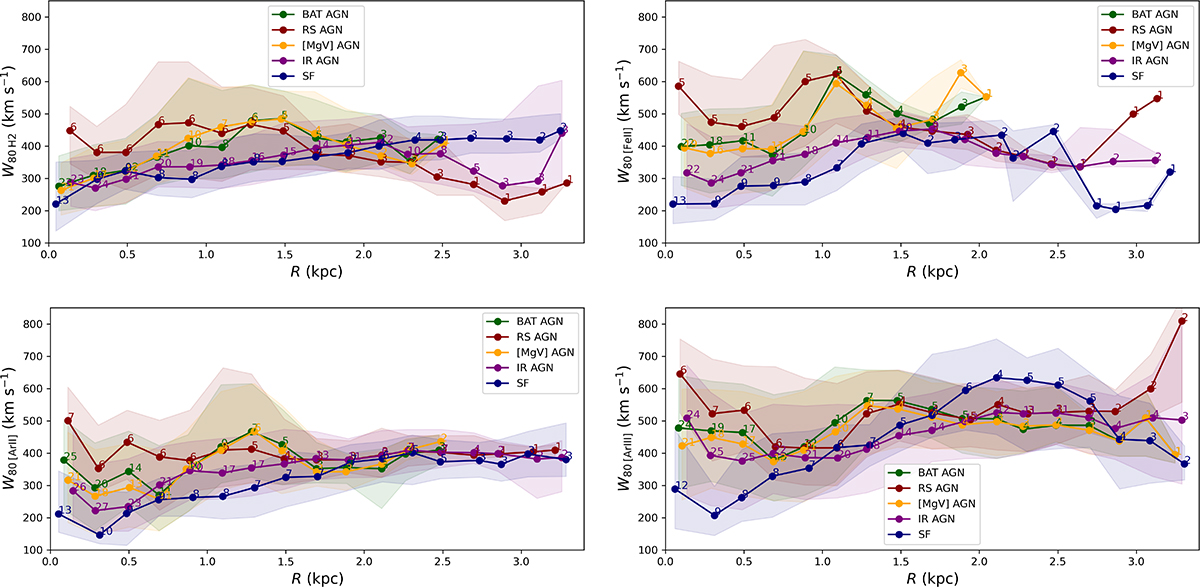
Download original image
Radial W80 profiles for H2 (top-left), [FeII] (top-right), [ArII] (bottom-left), and [ArIII] (bottom-right) for the five subsamples, as indicated by the different colours. These profiles are computed as median values of W80 and distance of the spaxel from the position of the continuum peak, within circular rings of 250 pc width. The numbers next to each point indicate the number of galaxies used to compute it, and the shaded regions represent the range between the 25th and 75th percentiles of the W80 values within each radial bin, illustrating the spread of values observed in each emission line.
Current usage metrics show cumulative count of Article Views (full-text article views including HTML views, PDF and ePub downloads, according to the available data) and Abstracts Views on Vision4Press platform.
Data correspond to usage on the plateform after 2015. The current usage metrics is available 48-96 hours after online publication and is updated daily on week days.
Initial download of the metrics may take a while.