Fig. 5.
Download original image
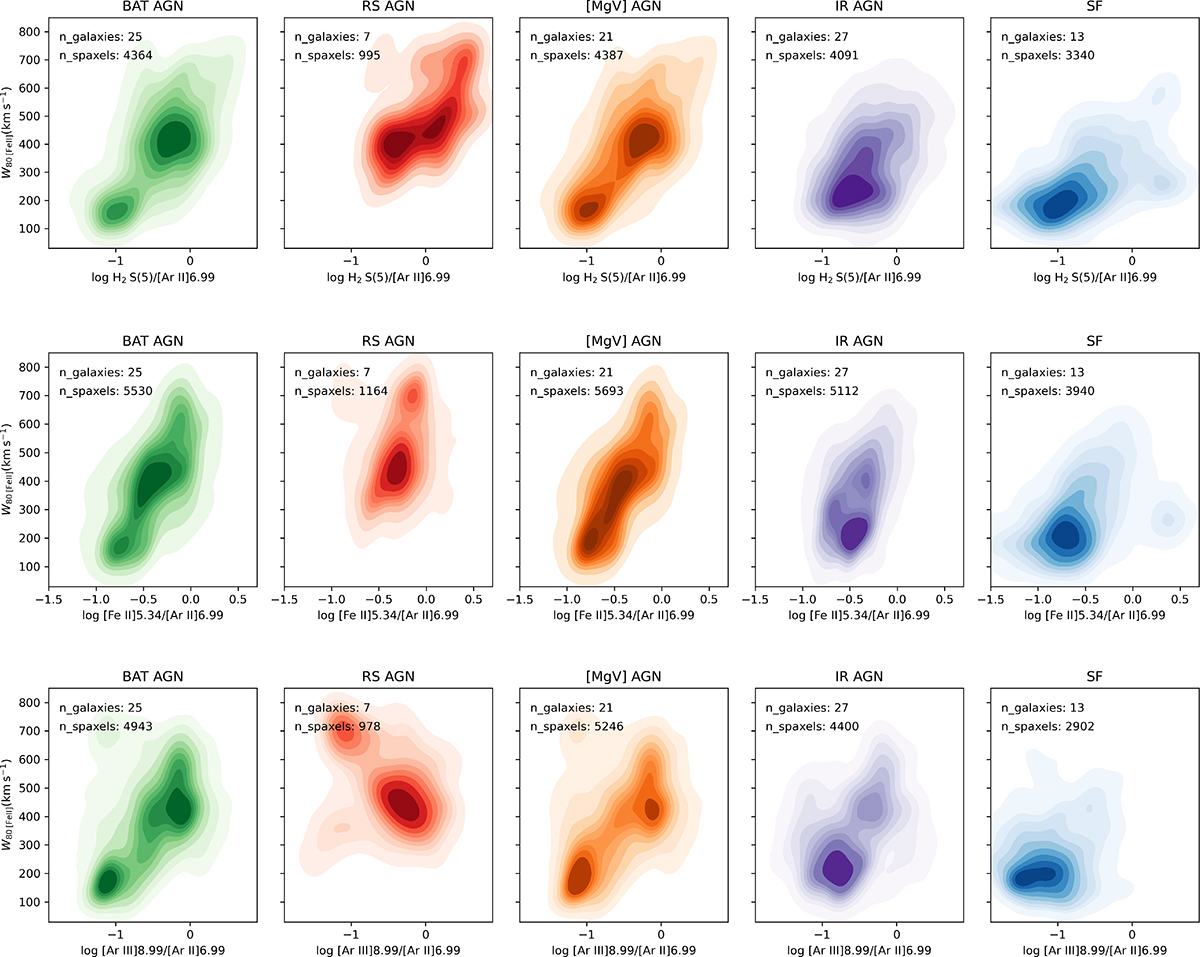
Density maps of W80 for [Fe II] λ 5.3403 μm emission line as a function of the flux ratios: H2 S(5) λ 6.9091 μm/[Ar II] λ 6.9853 μm (top panels), [Fe II] λ 5.3403 μm/[Ar II] λ 6.9853 μm (middle panels), and [Ar III] λ 8.9914 μm/[Ar II] λ 6.9853 μm (bottom panels). The contours are spaced at intervals of 10% in data density. Results are shown for the different subsamples, as identified in the title of each panel.
Current usage metrics show cumulative count of Article Views (full-text article views including HTML views, PDF and ePub downloads, according to the available data) and Abstracts Views on Vision4Press platform.
Data correspond to usage on the plateform after 2015. The current usage metrics is available 48-96 hours after online publication and is updated daily on week days.
Initial download of the metrics may take a while.