Fig. 6.
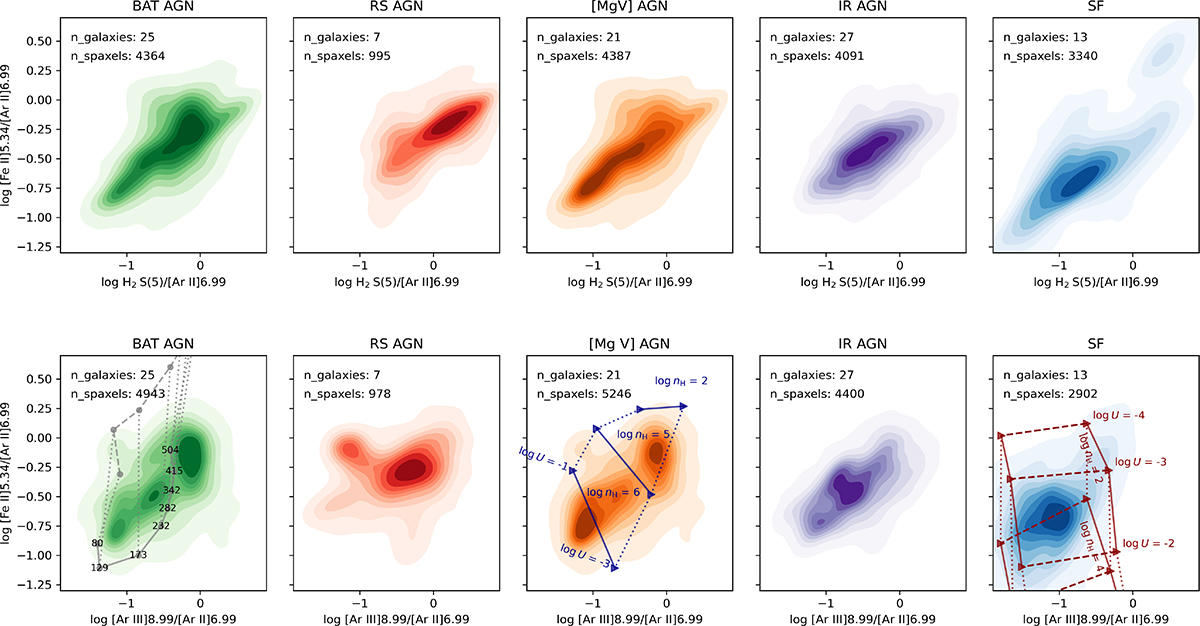
Download original image
Density plots for the [Fe II]λ5.3403 μm/[Ar II]λ6.9853 μm versus H2 S(5)/[Ar II]λ6.9853 μm (top panels) and [Fe II]λ5.3403 μm/[Ar II]λ6.9853 μm versus [Ar III]λ8.9914 μm/[Ar II]λ6.9853 μm (bottom panels). The dark red lines (bottom-right panel) show predictions from photoionisation models of star-forming regions, assuming stellar clusters aged 6 and 7 Myr. Solid lines indicate different gas densities, dotted lines correspond to varying ionisation parameters (as labelled in the figure), and the predictions for both cluster ages are connected by dashed lines. Similarly, results from AGN photoionisation models are shown as dark blue lines (bottom-central panel). The gray lines and filled circles (bottom-left panel) are predictions of fast shock models from Pereira-Santaella et al. (2024) using the MAPPINGS V code (Sutherland & Dopita 2017) for log RP = 6 (dashed) and log RP = 8 (continuous). The numbers indicate the shock velocities in kms−1.
Current usage metrics show cumulative count of Article Views (full-text article views including HTML views, PDF and ePub downloads, according to the available data) and Abstracts Views on Vision4Press platform.
Data correspond to usage on the plateform after 2015. The current usage metrics is available 48-96 hours after online publication and is updated daily on week days.
Initial download of the metrics may take a while.