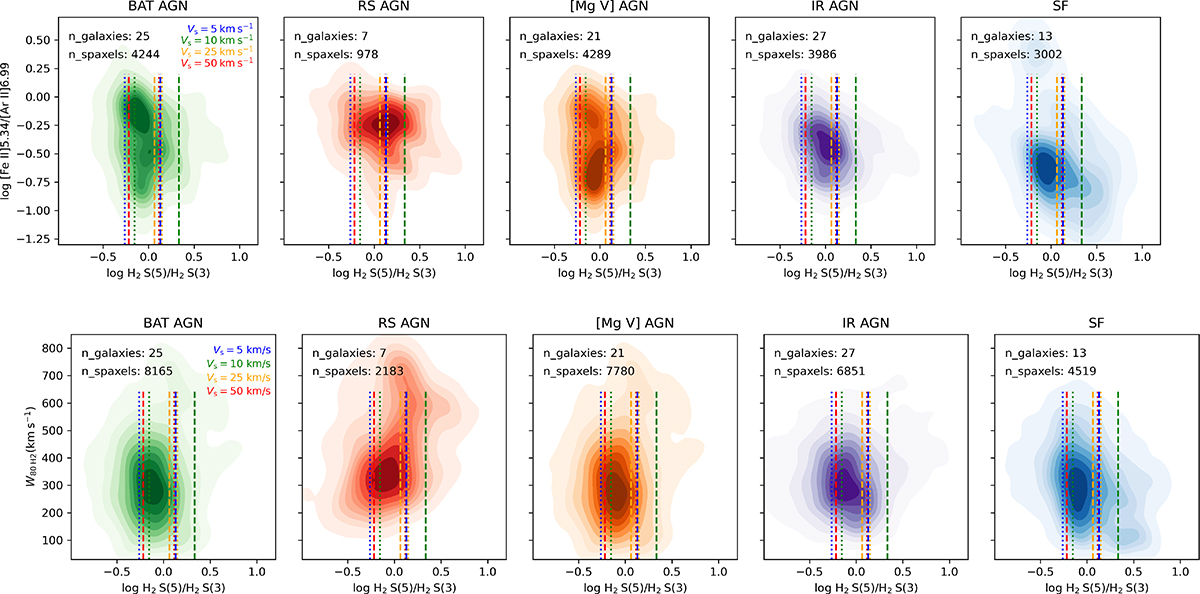
Fig. 7.
Download original image
Density plots for [Fe II]λ5.3403 μm/[Ar II]λ6.9853 μm vs H2S(5)/H2S(3) (top) and W80 for the H2 S(5) line vs H2S(5)/H2S(3) (bottom) for all sub-samples. The vertical lines represent the mean H2S(5)/H2S(3) predictions of the shock models from Kristensen et al. (2023) for velocities of 5, 10, 25, and 50 kms−1 (different colours) and densities of nH = 103 (dotted lines) and nH = 106 cm−1 (dashed lines).
Current usage metrics show cumulative count of Article Views (full-text article views including HTML views, PDF and ePub downloads, according to the available data) and Abstracts Views on Vision4Press platform.
Data correspond to usage on the plateform after 2015. The current usage metrics is available 48-96 hours after online publication and is updated daily on week days.
Initial download of the metrics may take a while.