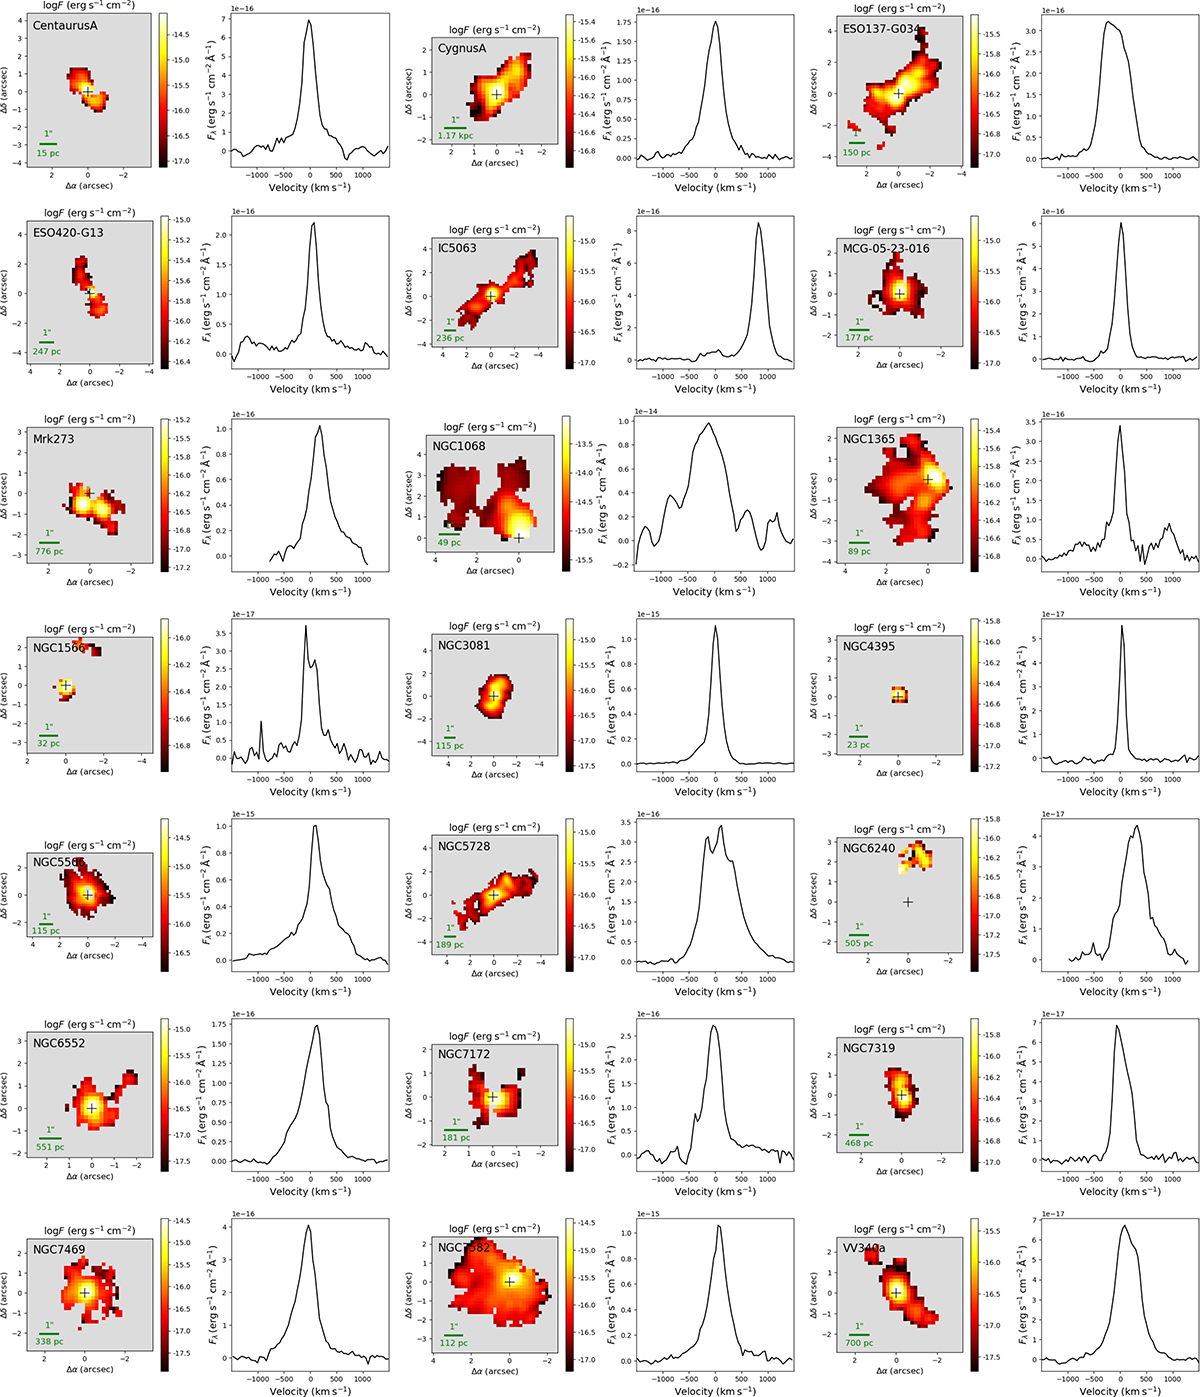
Fig. B.1.
Download original image
[MgV]λ5.6098 μm flux distributions for galaxies with coronal line emission in our sample. The maps illustrate the flux distributions, with gray regions indicating areas where the corresponding emission line is not detected at s/n > 5. The plots display the [MgV]λ5.6098 μm integrated profiles, obtained by summing the observed profiles across all detected spaxels and subtracting the continuum. The name of each galaxy is shown in the top-left corner of each plot, the spatial scale is shown in the bottom-left corner, and the central cross marks the position of the galaxy’s nucleus.
Current usage metrics show cumulative count of Article Views (full-text article views including HTML views, PDF and ePub downloads, according to the available data) and Abstracts Views on Vision4Press platform.
Data correspond to usage on the plateform after 2015. The current usage metrics is available 48-96 hours after online publication and is updated daily on week days.
Initial download of the metrics may take a while.