Fig. 2
Download original image
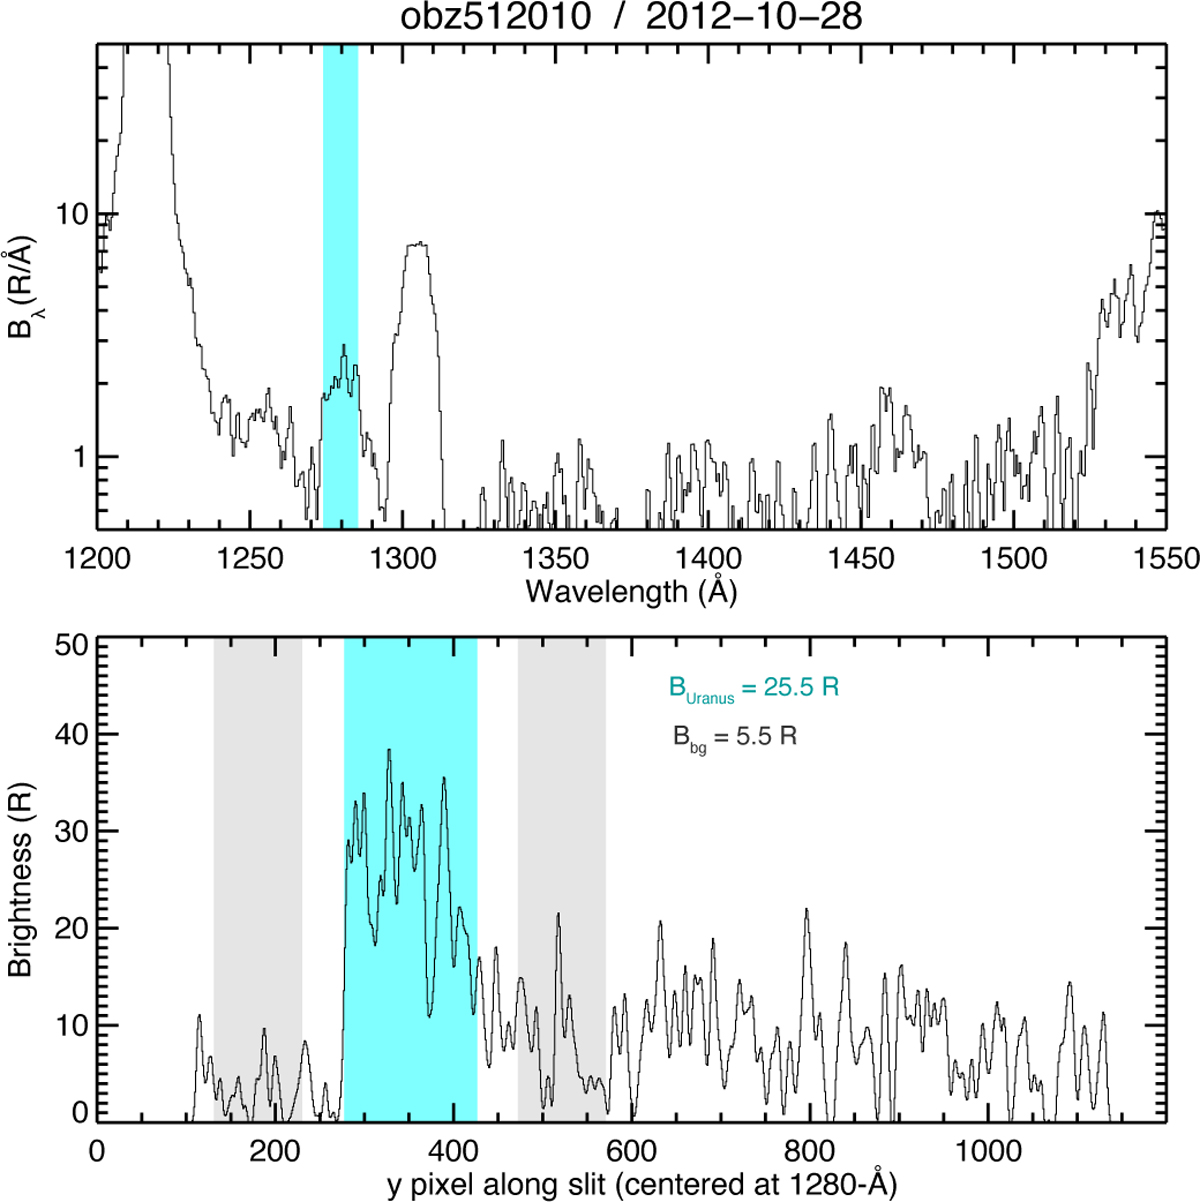
Observations of Uranus with HST/STIS, using the G140L grating and 0.5″-wide slit separate emissions at the vibrational Raman branch around 1280 Å from other Uranus and geocorona emissions. The upper panel shows the spectral flux (averaged over the spatial y-axis) as a function of wavelength. The bottom panel shows the wavelength-integrated brightness in Rayleigh along the slit. The average emission on Uranus’ disc (light blue shading) is 25.5 R. An average background of 5.5 R was measured away from the disc in two regions (shaded grey) along the slit.
Current usage metrics show cumulative count of Article Views (full-text article views including HTML views, PDF and ePub downloads, according to the available data) and Abstracts Views on Vision4Press platform.
Data correspond to usage on the plateform after 2015. The current usage metrics is available 48-96 hours after online publication and is updated daily on week days.
Initial download of the metrics may take a while.