Open Access
Fig. 3
Download original image
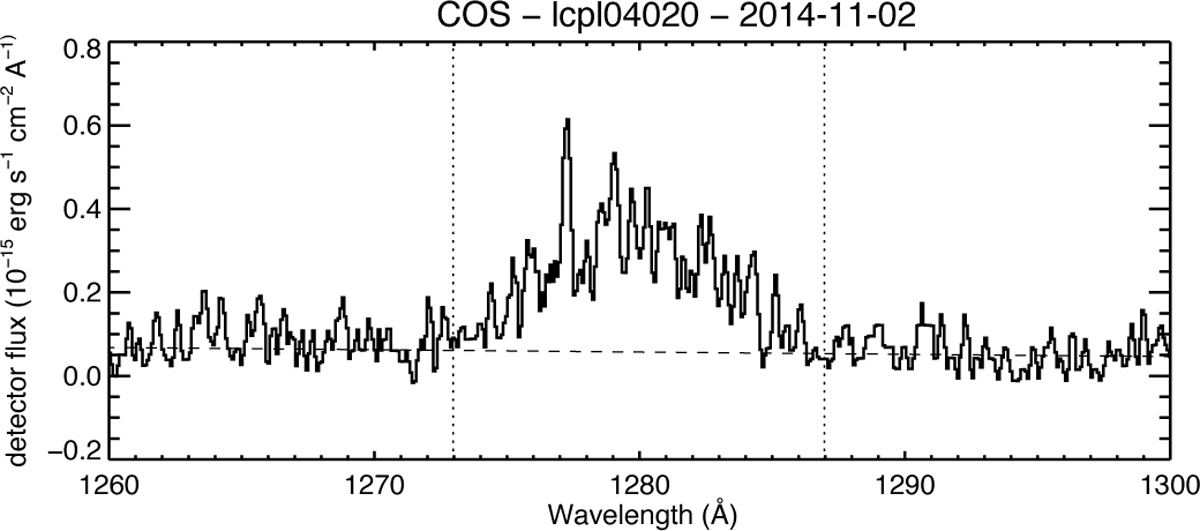
Spectral region around 1280 Å in HST/COS exposure taken with the G140L grating on November 2, 2014. All flux within the vertical dotted lines was integrated to extract the 1280 Å brightness feature. The dashed line shows a linear fit to the adjacent spectral regions used to correct for background emissions.
Current usage metrics show cumulative count of Article Views (full-text article views including HTML views, PDF and ePub downloads, according to the available data) and Abstracts Views on Vision4Press platform.
Data correspond to usage on the plateform after 2015. The current usage metrics is available 48-96 hours after online publication and is updated daily on week days.
Initial download of the metrics may take a while.