Open Access
Fig. 4
Download original image
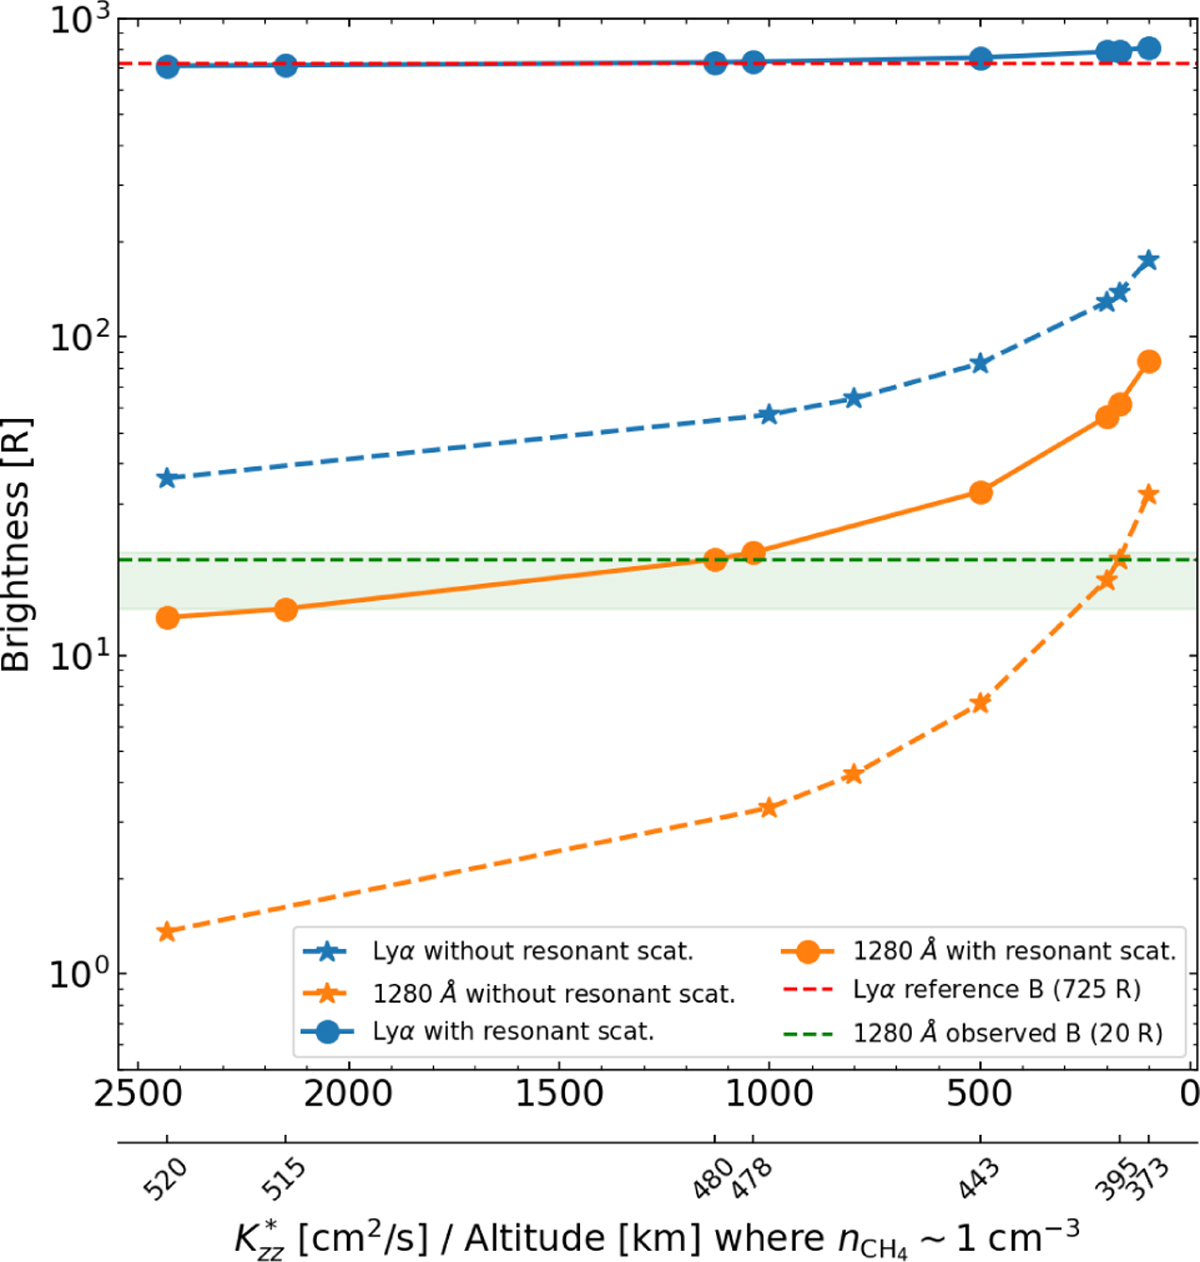
Lyman-alpha and 1280 Å brightness curves of growth with ![]() . The secondary x-axis indicates the altitudes where
. The secondary x-axis indicates the altitudes where ![]() . The dashed green line with a shaded green band represents the observed Raman feature brightness and its uncertainty, i.e.
. The dashed green line with a shaded green band represents the observed Raman feature brightness and its uncertainty, i.e. ![]() R.
R.
Current usage metrics show cumulative count of Article Views (full-text article views including HTML views, PDF and ePub downloads, according to the available data) and Abstracts Views on Vision4Press platform.
Data correspond to usage on the plateform after 2015. The current usage metrics is available 48-96 hours after online publication and is updated daily on week days.
Initial download of the metrics may take a while.