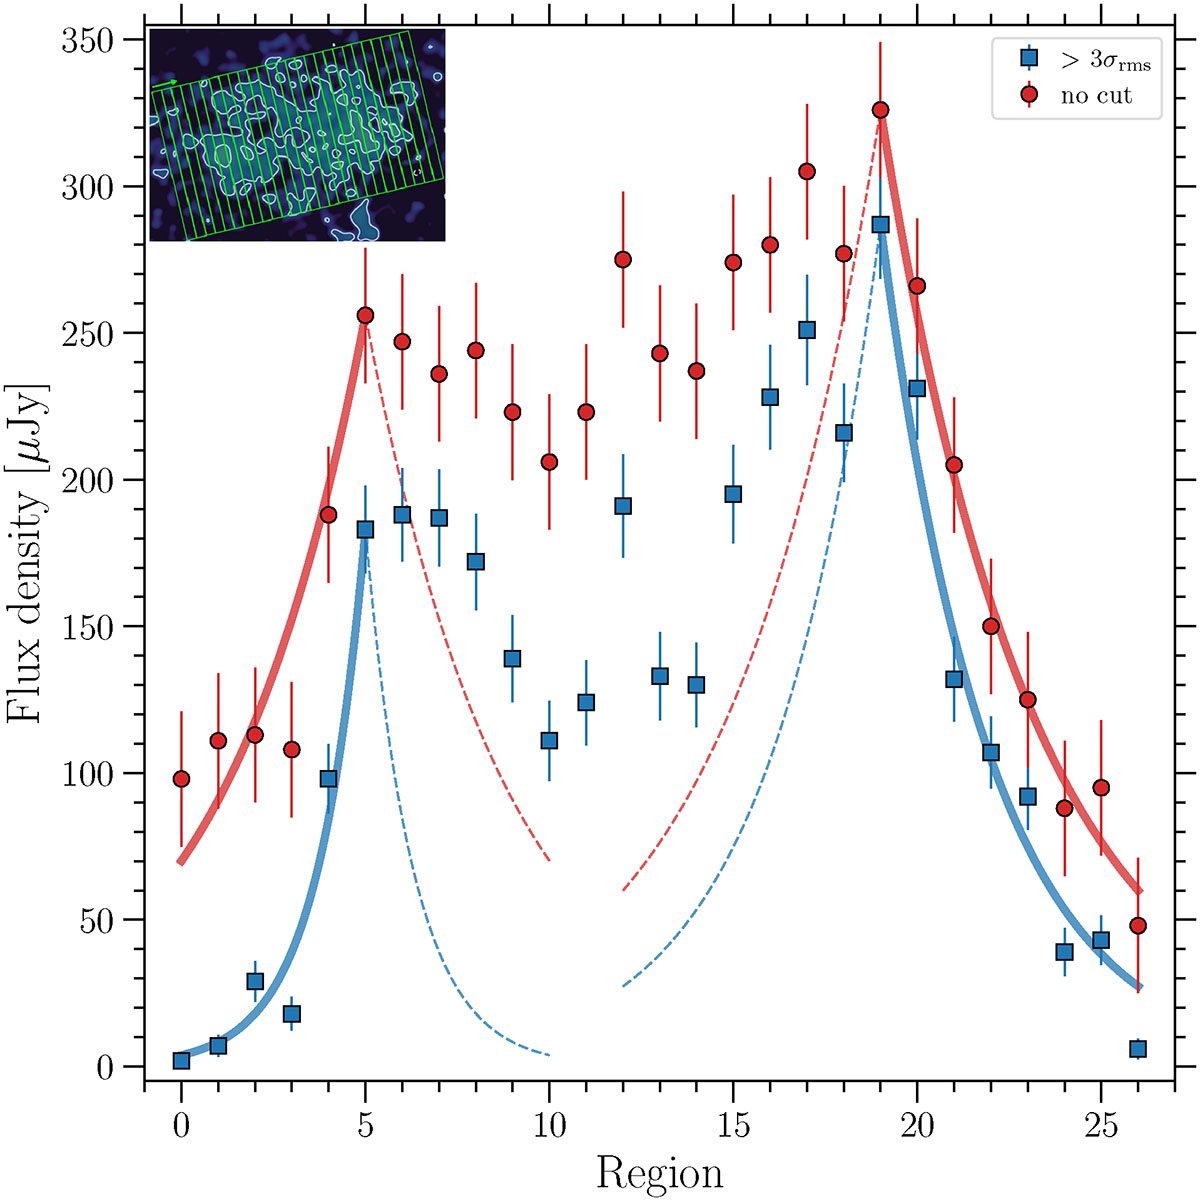
Fig. 5.
Download original image
Flux density profile across the cluster pair from east to west integrated above the 3σrms level and over the entire rectangular regions (see legend). The solid lines were obtained by fitting an exponential decaying model to the data points on the side away from the opposite cluster, starting from the emission peak. The dashed lines represent the mirrored model toward the other cluster.
Current usage metrics show cumulative count of Article Views (full-text article views including HTML views, PDF and ePub downloads, according to the available data) and Abstracts Views on Vision4Press platform.
Data correspond to usage on the plateform after 2015. The current usage metrics is available 48-96 hours after online publication and is updated daily on week days.
Initial download of the metrics may take a while.