| Issue |
A&A
Volume 705, January 2026
|
|
|---|---|---|
| Article Number | A230 | |
| Number of page(s) | 8 | |
| Section | Extragalactic astronomy | |
| DOI | https://doi.org/10.1051/0004-6361/202556824 | |
| Published online | 22 January 2026 | |
Enhanced radio emission between a galaxy cluster pair
1
INAF – IRA Via P. Gobetti 101 40129 Bologna, Italy
2
George P. and Cynthia Woods Mitchell Institute for Fundamental Physics and Astronomy, Texas A&M University College Station TX 77843, USA
3
Leiden Observatory, Leiden University PO Box 9513 2300 RA Leiden, The Netherlands
4
Istanbul University, Faculty of Science, Department of Astronomy and Space Sciences 34116 Istanbul, Türkiye
★ Corresponding author: This email address is being protected from spambots. You need JavaScript enabled to view it.
Received:
11
August
2025
Accepted:
3
December
2025
Abstract
Context. Interacting pairs of galaxy clusters offer a unique opportunity to study the properties of the gas residing in the intracluster bridge connecting them. As a consequence of the encounter, both the X-ray and radio emission from the gas are expected to be enhanced by shocks and turbulence, facilitating their detection.
Aims. PSZ2 G279.79+39.09 is likely an off-axis merging system at z = 0.29 with its two main cluster components observed at a projected distance of ∼1.3 Mpc. In this paper, we investigate the presence of diffuse radio emission associated with the system.
Methods. We observed this cluster pair with the MeerKAT UHF band (544–1088 MHz) for 7.5 h and with the uGMRT band 3 (300–500 MHz) for 8 h. These are the first targeted radio observations of this system.
Results. We discovered diffuse synchrotron emission in the system, with an indication of enhanced emission in the region bridging the cluster pair. The detection is based on the MeerKAT UHF data, while the uGMRT band 3 observation does not allow us to derive a stringent limit on the spectral index of the source. This emission is likely generated by the turbulence injected as a consequence of the cluster-cluster encounter. However, the study of its physical properties is limited by the observations currently available for the target. If the two clusters have not yet collided, this emission will resemble the radio bridges observed in A399-A401 and A1758N-S.
Conclusions. Similarly to other systems with multiple cluster components studied in recent years, the analyzed cluster pair represents an appealing target to investigate the presence of nonthermal phenomena beyond the well-studied denser regions of the intracluster medium. While in this work we presented a new detection, our analysis underlines the need for multiband observations to fully understand these kinds of sources.
Key words: radiation mechanisms: non-thermal / galaxies: clusters: general / galaxies: clusters: intracluster medium / galaxies: clusters: individual: PSZ2 G279.79+39.09
© The Authors 2026
 Open Access article, published by EDP Sciences, under the terms of the Creative Commons Attribution License (https://creativecommons.org/licenses/by/4.0), which permits unrestricted use, distribution, and reproduction in any medium, provided the original work is properly cited.
This article is published in open access under the Subscribe to Open model. This email address is being protected from spambots. You need JavaScript enabled to view it. to support open access publication.
1. Introduction
Cluster mergers stand as the most energetic events in the Universe since the Big Bang. Upon collision, they inject turbulence and shocks into the intracluster medium (ICM), often giving rise to expansive synchrotron sources such as radio halos and relics (e.g., van Weeren et al. 2019). These cluster-wide nonthermal phenomena are nowadays observed in numerous massive clusters undergoing merger events (e.g., Knowles et al. 2022; Botteon et al. 2022; Duchesne et al. 2024). Halos and relics allow us to investigate the complex mechanisms at play within the ICM, where kinetic energy of large-scale motions can be channeled into electromagnetic fluctuations and particle acceleration on a smaller scale (e.g., Brunetti & Jones 2014). These radio sources also serve as probes for studying the astrophysical processes associated with galaxy cluster mergers and, in general, contribute to our understanding of the formation and evolution of the large-scale structure in the Universe.
In recent years, there has been significant interest in the study of physically bound cluster pairs or systems with multiple cluster components. Observing closely spaced clusters, where individual components can be clearly identified (e.g., as distinct X-ray-emitting clumps), gives us the opportunity to study the properties of the intracluster gas, beyond the dense cores that are more easily accessible to observations (e.g., Werner et al. 2008; Kato et al. 2015; Bulbul et al. 2016; Akamatsu et al. 2016; Caglar & Hudaverdi 2017; Caglar 2018; Kaya et al. 2019; Alvarez et al. 2022; Mirakhor et al. 2022; Omiya et al. 2023; Migkas et al. 2025). Indeed, as a consequence of the encounter, both the X-ray and radio emissions in the bridges of matter connecting the clusters are expected to be boosted (Vazza et al. 2019). The detection of the radio bridges connecting the cluster pairs A399-A401 (Govoni et al. 2019) and A1758N-S (Botteon et al. 2018, 2020b) has demonstrated that relativistic particles can be accelerated by mechanisms operating on scales larger than the individual clusters, in physical regimes that are poorly explored. One hypothesis is that these radio bridges are powered by novel particle acceleration mechanisms triggered by turbulence generated in the bridges of matter connecting dynamically active clusters (Brunetti & Vazza 2020). This model predicts that the radio bridge emission is volume-filling and characterized by steep synchrotron spectra (i.e., α ≳ 1.3, where Sν ∝ ν−α). This scenario seems to be supported by the follow-up observations of A399-A401 and A1758N-S (Botteon et al. 2020b; de Jong et al. 2022; Nunhokee et al. 2023; Pignataro et al. 2024b). It is worth noting, however, that reports of diffuse radio emission in clusters with two or more components are not limited to the cases of A399-A401 and A1758N-S. A number of targeted observations using various Square Kilometer Array (SKA) pathfinder and precursor instruments have revealed diffuse synchrotron sources located in between other clusters (Gu et al. 2019; Duchesne et al. 2021b; Hoeft et al. 2021; Venturi et al. 2022; Pignataro et al. 2024a; Hu et al. 2025; Stuardi et al. 2025), while others have resulted in non-detections (Botteon et al. 2019a,b; Brüggen et al. 2021; Pignataro et al. 2024c). The emerging picture is that extended synchrotron sources in these environments are not ubiquitous and can exhibit a broad range of morphologies, sometimes appearing as bridges of radio emission connecting X-ray clumps, and in other cases as filamentary and/or elongated structures. Whether all these sources can be attributed to the same dynamical processes and acceleration mechanisms remains unclear, motivating further theoretical and observational work on systems with multiple cluster components.
PSZ2 G279.79+39.09 (hereafter G279+39) was identified in the second Planck catalog of Sunyaev-Zel’dovich (SZ) sources (Planck Collaboration XXII 2016). It forms a massive (M500 = 6.12 × 10¹⁴ M⊙) binary cluster at z = 0.29, in which its eastern and western components, identified by their X-ray emission, are separated by a projected distance of ∼1.3 Mpc. This system has been overlooked in the literature, lacking a detailed study in any band. We recently analyzed the XMM-Newton observation available for this system and characterized the properties of the two subclusters and the thermal emission between them (Döner et al. 2025). Our analysis suggests that G279+39 is a massive cluster pair exhibiting X-ray asymmetries, indicative of ram-pressure stripping, and high temperatures in the region connecting the two subclusters, consistent with shock-heated or compressed gas. These features support a scenario in which the two systems are undergoing a merger with a nonzero impact parameter and are observed close to the core passage (≲0.5 Gyr before or after). However, whether the clusters have already reached or are approaching pericenter remains uncertain, as their projected separation and observed properties are consistent with both phases seen in idealized binary merger simulations (ZuHone et al. 2018). In this paper, we present new MeerKAT UHF (Jonas 2009) and upgraded Giant Metrewave Radio Telescope (uGMRT; Gupta et al. 2017) band 3 observations of G279+39 with the goal of investigating the presence of diffuse radio emission in the system. In particular, in Section 2, we describe the data and processing of the radio observations. In Section 3, we present the results based on the analysis of our new radio images. In Sections 4 and 5, we discuss the findings of our work and summarize our conclusions, respectively.
Throughout the paper, we adopted a ΛCDM cosmology with ΩΛ = 0.7, Ωm = 0.3 and H0 = 70 km s−1 Mpc−1. This corresponds to a scale conversion factor of 4.350 kpc/arcsec and a luminosity distance of DL = 1493 Mpc at the redshift of G279+39.
2. Data reduction
2.1. MeerKAT
We observed G279+39 with MeerKAT UHF (544–1088 MHz) for 7.5 h (project code SCI-20241101-AB-02, PI: A. Botteon) on 2025 February 13. The bandwidth of the observation was 544 MHz and was covered with 4096 channels. The observing time includes three 10-min scans on the flux and bandpass calibrators (J0408-6545 and J1939-6342) and a 2-min scan on the gain calibrator J1051-2023 following each passage on the target.
After downloading the data calibrated through the SARAO Science Data Processor (SDP) calibration pipeline, we used the facetselfcal.py1 script (van Weeren et al. 2021) to improve the calibration on the field. This script was extensively used to calibrate LOFAR observations and has also recently been adapted and successfully applied to MeerKAT data (see Botteon et al. 2024, 2025; Balboni et al. 2026; van Weeren et al. 2026). As a first step, residual radio frequency interference not flagged by the SDP pipeline was removed using AOFLAGGER (Offringa et al. 2010, 2012). Low signal-to-noise (S/N) channels at the edges of the band were also discarded. The data were then averaged using Default PreProcessing Pipeline (DP3; van Diepen et al. 2018) and compressed with DYSCO (Offringa 2016). Due to the strong ionospheric errors, we performed a series of “scalarphase + scalarcomplexgain” direction-dependent (DD) calibration cycles on a large field of view (FoV) of 4.17 ° ×4.17° using eight directions, partially correcting for the ionospheric distortions. To further improve the calibration, sources outside a reduced FoV of 1.15 ° ×1.15° were removed, and a new DD calibration was performed using seven updated directions, successfully correcting for most of the remaining DD effects in the field. Given the relatively small angular extent of our target, we further limited the visibility data to a FoV of 0.26 ° ×0.26° to enable faster reimaging. On this smaller FoV, a final cycle of direction-independent (DI) calibration was carried out, effectively reducing residual artifacts around NVSS J113521−201957, a bright radio galaxy belonging to G279+39.
Final imaging was done with WSCLEAN v3.6 (Offringa et al. 2014), adopting a robust weighting of the visibilities of −0.5 (Briggs 1995) and the multiscale multifrequency deconvolution algorithm (Offringa & Smirnov 2017). Our full-resolution image (9.0″ × 8.0″) has a noise of 4.7 μJy beam−1. To enhance the S/N of the faint diffuse emission, we also produced source-subtracted images at a lower resolution (see Section 3). The central frequency of our MeerKAT images is 822 MHz and the assumed uncertainty on the flux density scale is 15% (e.g., Sikhosana et al. 2025).
2.2. uGMRT
We observed G279+39 with the uGMRT in band 3 (300–500 MHz) for 8 h (project code: 47_058, PI: T. Caglar) on 2025 January 6. We employed the GMRT Wideband Backend (GWB; Reddy et al. 2017), spanning 200 MHz of bandwidth, which was covered with 4096 channels. The flux density calibrators 3C147 and 3C286 were observed for 12 min each at the start and at the end of the observation, respectively.
The processing was carried out with the Source Peeling and Atmospheric Modeling (SPAM; Intema et al. 2009) pipeline, which performs instrumental calibration (bandpass and flux density scale), data averaging, flagging, and DD calibration. The 200 MHz bandwidth was divided by SPAM into six frequency slices of 33.3 MHz each, which were processed independently. This is because SPAM was originally developed to processed GMRT Software Backend (GSB; Roy et al. 2010) data, which had a smaller bandwidth. Once calibrated, the six frequency slices were jointly imaged with WSCLEAN in a similar manner to that described above for MeerKAT. For reference, our full-resolution image (8.3″ × 4.5″), obtained with a robust weighting of the visibilities of −0.5, has a noise of 28 μJy beam−1. The central frequency of our uGMRT images is 400 MHz and the assumed uncertainty on the flux density scale is 10% (Chandra et al. 2004).
3. Results
A multiband view of G279+39 is shown in Fig. 1. In the optical, the eastern subcluster is dominated by the brightest cluster galaxy (BCG), which coincides with the peak of the X-ray emission and hosts a compact radio core (RA: 11h35m42.69s; Dec: −20°21′06.21″, cross marker). The western subcluster appears more optically rich and, at the center of its X-ray emission, hosts the brightest radio galaxy in the field (NVSS J113521−201957), which exhibits jets resolved in the east-west direction (RA: 11h35m21.35s; Dec: −20°19′56.76″, diamond marker). Their angular separation of ∼308 arcsec corresponds to a projected physical distance of ∼1340 kpc at z = 0.29.
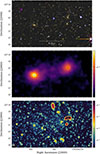 |
Fig. 1. Multiband view of G279+39. Top: Optical g,r,z image from the DESI Legacy Imaging Surveys (Dey et al. 2019). Center: X-ray adaptively smoothed image in the 0.5–2.0 keV band with point sources removed (Döner et al. 2025). Bottom: MeerKAT radio image at 822 MHz with a beam of 9.0″ × 8.0″ (shown in the bottom left corner) and a noise of σrms = 4.7 μJy beam−1. The cross and diamond markers indicate the position of the galaxies mentioned in the text. The color bar units are counts s−1 for the X-ray image and Jansky beam−1 for the radio image. |
Despite the relatively high angular resolution of the MeerKAT image in Fig. 1, there is an indication that low-level diffuse emission is present in the system. We note that this emission was picked up by the model during the deconvolution process, and that the sensitivity of the uGMRT image is significantly lower (Fig. A.1). To assess whether the emission is mainly diffuse or instead due to unresolved point sources, we produced a MeerKAT image using only baselines longer than 1500λ. In this image, shown alongside the image without inner uv-cut in Fig. 2 (top panels), the extended emission disappears, suggesting that the signal is indeed associated with short baselines, and thus originates from diffuse, low surface brightness structure. The bottom panel of the figure shows the fractional residual between the images in the top panels, highlighting the presence of excess diffuse emission in the cluster pair.
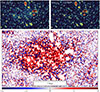 |
Fig. 2. Highlighting the diffuse radio emission excess in G279+39. Top panels: MeerKAT images obtained by imaging all baselines (left, same as in Fig. 1) and only baselines longer than 1500λ (right). Bottom panel: Fractional difference image, computed by subtracting the top right image from the top left image and dividing the result by the former. |
Disentangling the contribution of discrete sources to that of the diffuse emission is a crucial but difficult task, and results can significantly change if this step is done in the image plane or uv plane (e.g., Botteon et al. 2025; Rajpurohit et al. 2025). Here, we adopted both approaches to assess the robustness of the procedure. In the top panel of Fig. 3, we show the result obtained by reimaging the MeerKAT data at lower resolution after subtracting from the visibility data the model of the discrete sources shown in Fig. 2 (top right panel). In the bottom panel of Fig. 3, we present the result of the image-plane subtraction. This was performed by masking all pixels above 2σ in the high-resolution image of Fig. 2 (top right panel), and subsequently convolving the image to match the resolution of the uv-plane-subtracted image for a direct comparison. Overall, the morphology of the radio contours is broadly consistent between the two methods, confirming the presence of faint extended emission in the system. Notably, diffuse emission is observed connecting the two clusters, spatially aligned with the X-ray emission bridge (Fig. 4). This is the only region in the field where there is significant diffuse radio emission in MeerKAT, whereas the uGMRT provides a non-detection, as is shown in the large-FoV images of Fig. A.2. The implications of this non-detection on the spectral index of the emission will be discussed at the end of the next section.
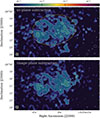 |
Fig. 3. Source-subtracted low-resolution MeerKAT images at 822 MHz. Top: Image produced by subtracting compact sources in the uv plane and reimaging the visibilities with a Gaussian taper, yielding a beam of 16.8″ × 16.3″ and a noise of σrms = 6.3 μJy beam−1. The yellow ellipse denotes the region used to extract the flux densities of the diffuse emission. Bottom: Image obtained by subtracting compact sources in the image plane at high resolution, then convolving the result to the same 16.8″ × 16.3″ beam. Solid contours are spaced by a factor of 2 from the 3σrms level. The −3σrms contour is shown in dashed. The beams are shown in the bottom left corners. The color bar units are Jansky beam−1. |
In the following, we adopt the image with source subtraction performed in the uv plane, as the use of a Gaussian taper in this approach allows for a more reliable deconvolution of the extended flux. The extended emission projected size is ∼1500 kpc × 800 kpc. Its flux density integrated over the pixels above 3σrms (2σrms) located within the yellow ellipse shown in Fig. 3 (top panel) is S = 3.5 ± 0.1 ± 0.5 mJy (4.4 ± 0.1 ± 0.7 mJy). As an alternative estimate, we extrapolated the average surface brightness of the diffuse emission over the regions where discrete sources were subtracted, obtaining S = 3.7 ± 0.1 ± 0.6 mJy (4.3 ± 0.1 ± 0.6 mJy). The two methods provide consistent results within the statistical errors (reported first). The total error budget is dominated by the systematic uncertainty (reported second). The k-corrected radio power (assuming α = 1.3) at 822 MHz is P = 1.0 ± 0.1 × 1024 W Hz−1 (1.3 ± 0.2 × 1024 W Hz−1).
4. Discussion
The newly discovered extended radio emission connects the two X-ray clumps (Fig. 4) and exhibits two surface brightness peaks: one in the east, near the peak of the eastern cluster X-ray emission (possibly indicating the presence a radio halo-like source), and another in the west, offset by ∼300 kpc from the center of the western cluster X-ray emission. The origin of the latter radio peak is unclear, as it could trace a region where the radio emission is higher, either due to the local dynamics of the thermal gas (which may boost the nonthermal emission) or due to the presence of relativistic plasma injected in the medium by cluster radio galaxies. The two peaks can also be noticed in the profiles shown in Fig. 5, which were derived by integrating the flux density within rectangular regions of 16″ width along the source extension (see inset). Starting from each peak, we fit the data points on the side opposite the other cluster with a decaying exponential model and mirrored the resulting profile toward the center of the cluster pair. These fits are not intended to have any physical meaning, but are rather used to visualize that the emission between the clusters declines more gradually, and that it is not simply due to the superposition of the two exponential profiles. This suggests that the radio emission connecting the two clusters has been enhanced during their interaction.
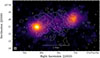 |
Fig. 4. X-ray image with the MeerKAT low-resolution radio contours with sources subtracted in the uv plane overlaid. The beam of the radio image is shown in the bottom left corner. |
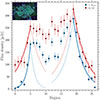 |
Fig. 5. Flux density profile across the cluster pair from east to west integrated above the 3σrms level and over the entire rectangular regions (see legend). The solid lines were obtained by fitting an exponential decaying model to the data points on the side away from the opposite cluster, starting from the emission peak. The dashed lines represent the mirrored model toward the other cluster. |
The faint radio emission, which closely follows the X-ray morphology of the thermal gas, likely originates from turbulence in the region between the two interacting clusters. Since it remains uncertain whether G279+39 is observed before or after pericenter passage (Döner et al. 2025), we discuss the interpretation for its origin in both dynamical scenarios.
In the pre-pericenter case, G279+39 would resemble systems such as A399-A401 and A1758N-S, which have been classified as systems that have not yet reached core passage (e.g., Sakelliou & Ponman 2004; David & Kempner 2004; Hincks et al. 2022; Machado et al. 2024). In these cluster pairs, the presence of radio bridges connecting the two subclusters is particularly intriguing, as it implies the activation of mechanisms capable of reaccelerating relativistic particles and amplifying magnetic fields prior to the cluster-cluster collision (Brunetti & Vazza 2020). A notable difference between G279+39 and these two cluster pairs is the separation of the subclusters: ∼1.3 Mpc for G279+39, ∼2 Mpc for A1758N-S, and ∼3 Mpc for A399-A401. Since these are sky-projected distances, they represent lower limits on the true 3D separations. Among these systems, only for A399-A401 have there been attempts to estimate the actual spatial separation between the two subclusters (Akamatsu et al. 2017; Bonjean et al. 2018; Hincks et al. 2022). In the case of G279+39, which is closer to pericenter passage, the true physical separation between the two subclusters is not expected to be significantly larger than the projected value. Estimating the 3D separation between the eastern and western components will require dedicated follow-up observations, particularly spectroscopic optical data to assess the presence of a potential merger component along the line of sight.
In the post-pericenter case, the formation of extended radio emission can be more easily explained within the framework of turbulent reacceleration. Indeed, in this case, turbulence is naturally generated in the wake of the interacting clusters (e.g., Roettiger et al. 1997, 1999; Iapichino et al. 2008), where it can dissipate part of its energy into nonthermal components, producing diffuse synchrotron emission. Similar phenomena have been observed in radio halos that exhibit surface brightness extensions due to the interaction with subclusters identified either in the optical or X-ray band (e.g., Kim et al. 1989; Botteon et al. 2019a; Pignataro et al. 2024a). When the X-ray clumps of the interacting clusters are clearly separated and the radio emission lies in the region between them, the diffuse emission has been sometimes referred to as a “radio bridge”. The prime example is represented by the extended emission located between the Coma cluster and the NGC4839 galaxy group (for recent analyses, see Bonafede et al. 2021; Churazov et al. 2021; Mirakhor et al. 2023). As this is also the case in G279+39, the radio emission in this system could still be referred to as a radio bridge, even in this dynamical scenario. We therefore suggest that, whenever the term radio bridge is used, the dynamical stage of the cluster-cluster encounter should be specified, if possible.
Given the small projected separation between the subclusters in G279+39 one might wonder whether the diffuse emission in this system can be decomposed into distinct components (e.g., halos and bridge), or whether it should be treated as a single, continuous structure. Or, to rephrase it differently, one might wonder how far apart the two interacting clusters must be, before or after pericenter passage, to be considered independent systems. From an observational point of view, distinguishing the individual components is only possible if the data have sufficient resolution and sensitivity to resolve separate substructures (both morphologically and, eventually, spectrally). We believe that this is not the case for our MeerKAT data, and therefore would tend to consider the radio emission in G279+39 as a whole.
The subsequent interpretation of the physical properties of the diffuse emission in G279+39 is limited by the unknown 3D geometry of the system and the lack of spectral index information (see the end of this section for further discussion on the latter). Keeping this limitation in mind, we can adopt the standard assumptions of the source lying in the plane of the sky and a spectral index of α = 1.3 to estimate basic physical properties of the source. These can then be compared with those of radio halos and bridges to evaluate potential similarities and differences with these two classes of sources.
For example, assuming an oblate (prolate) ellipsoidal geometry with semiaxes rmaj = 750 kpc and rmin = 400 kpc, the volume of emission would be V = 1.48 × 1073 cm3 (2.77 × 1073 cm3). Assuming that the radio emission is uniform in the volume, its mean radio emissivity at 822 MHz is ⟨ϵ⟩=P/V = 8.58 × 10−43 erg s−1 Hz−1 cm−3 (4.48 × 10−43 erg s−1 Hz−1 cm−3). Here we adopted the flux density integrated above the 2σrms level (S = 4.4 mJy); assuming that the 3σrms level measurement (S = 3.5 mJy), the emissivity would be ∼20% lower. Extrapolating the results at 1.4 GHz, the emissivity would fall in the range of 2.3 − 4.3 × 10−43 erg s−1 Hz−1 cm−3, i.e., at the low end of the emissivity distribution of radio halos (Murgia et al. 2024). For comparison, the emissivities estimated for the bridges in A399-A401 and A1758N-S are an order of magnitude lower (Govoni et al. 2019; Botteon et al. 2020b). Interpreting the higher emissivity in G279+39 is challenging given its uncertain merger phase. If the system is observed before pericenter passage, the high value may suggest that radio bridges can span a broad range of emissivities (similar to radio halos) and that this could, for example, depend on the separation between the two clusters. In the post-pericenter scenario, numerical simulations predict that the turbulent energy flux is higher (e.g., Vazza et al. 2017), which may in turn lead to higher synchrotron emissivities. The XRISM satellite is currently probing the velocity dispersion and bulk velocity in the ICM with X-ray microcalorimeter spectroscopy (XRISM Collaboration 2025a,b,c,d,e). Although observationally very demanding, extending such measurements to intracluster bridges would be crucial to constrain the level of turbulence and, in turn, understand the efficiency of particle acceleration in these low-density environments. Similarly, following the evolution of relativistic electrons in numerical simulations through tracer particles in the region between colliding clusters, both before and after core passage, would help us to determine whether the properties of the radio emission in bridges differ between the two dynamical phases. We again remind the reader that the estimates reported above rely on the following assumptions: that the source lies in the plane of the sky, uniformly fills an ellipsoidal volume, and has a spectral index of α = 1.3.
The power of radio halos is known to strongly correlate with cluster mass. This P–M relation has been the focus of several statistical studies, mostly relying on SZ-derived cluster masses from Planck (e.g., Cassano et al. 2013; Duchesne et al. 2021a; Cuciti et al. 2021, 2023; van Weeren et al. 2021). As G279+39 is a Planck cluster, we can assess where it lies in the P–M plane by using the most recent relation derived at a frequency close to our MeerKAT 822 MHz observation; that is, the relation at 1.4 GHz obtained by Cuciti et al. (2021). The extrapolated power of G279+39 at 1.4 GHz is 6.3 × 10²³ W Hz−1, placing it a factor of ≲2 below the best-fit relation2, in the region mostly occupied by upper limits and ultra-steep spectrum radio halos. It is worth noting that the mass of G279+39 is close to the mass cut of M500 > 6 × 10¹⁴ M⊙ of the sample considered by Cuciti et al. (2021); therefore, it lies near the boundary where the relation becomes less constrained. Moreover, the mass estimate from Planck for cluster pairs at moderate redshift is limited by the low angular resolution of the instrument, which prevents it from resolving the individual SZ components of closely spaced systems, potentially biasing the mass measurement (see Botteon et al. 2018, for a similar argument on A1758N-S). In these cases, the Planck mass is likely more representative of the most massive component, that in G279+39 is the eastern subcluster. Overall, it seems reasonable to conclude that G279+39 falls below the P–M relation of radio halos. We note that, in the turbulent reacceleration scenario, underluminous radio halos are generally expected in the early or late stages of cluster mergers (Donnert et al. 2013).
Lastly, we comment on the non-detection of diffuse emission in the uGMRT data (Figs. A.1 and A.2), showing that the emission recovered by MeerKAT is too faint to obtain a meaningful limit on the spectrum using the available uGMRT observation. As an optimistic estimation, we calculated the upper limit on the flux density at 400 MHz to be  , where Nbeam = Asource/Abeam is the ratio between the area covered by the emission to that of the beam. We adopted the 2σrms level as the threshold, as it represents the limit above which the flux density of an extended radio source can be considered reliable (e.g., Botteon et al. 2020a). We assumed that the emission covers the same area covered in the MeerKAT image, adopting an ellipse with Asource = π(750 × 400) kpc2. By considering the resolution and noise of the uGMRT image of Fig. A.2 (left panel), the 2σrms upper limit on the 400 MHz flux density becomes
  mJy. This translates to an upper limit on the spectral index of α ≲ 1.6 − 1.8, depending on whether the integrated flux density at the 2σrms or 3σrms level in MeerKAT is used. A more stringent limit at the 3σrms level on the 400 MHz flux density would instead imply α ≲ 2.2 − 2.5. As was anticipated, these values, which were obtained using an optimistic approach, are not useful to derive meaningful insights on the spectral index (and thus on the origin) of the diffuse emission. A more rigorous method would require one to inject fake radio emission in the visibility data to estimate the upper limit, taking fully into account the flux density losses due to the missing short spacings and sparse uv-coverage of the interferometric data (see e.g., Johnston-Hollitt & Pratley 2017; George et al. 2021; Bruno et al. 2023). We did not pursue this approach here as it would lead to even looser constraints. The reader is informed that the reported upper limits, despite already being relatively weak, were deliberately derived under favorable assumptions.
5. Conclusions
We reported on MeerKAT 822 MHz and uGMRT 400 MHz observations of PSZ2 G279.79+39.09 (G279+39), a poorly studied galaxy cluster pair at z = 0.29, likely observed close (either before or after) pericenter passage. In X-rays, the two clusters, which are separated by a projected distance of ∼1.3 Mpc, are connected by a bridge of thermal gas. Our MeerKAT radio images revealed the presence of diffuse emission in the pair, while the uGMRT ones resulted in a non-detection due to the lower sensitivity. The emission is stretched along the east-west direction, with a projected size of ∼1500 kpc × 800 kpc and a radio power at 822 MHz integrated above 3σrms (2σrms) of 1.0 ± 0.1 × 1024 W Hz−1 (1.3 ± 0.2 × 1024 W Hz−1).
From the flux density profile extracted along the cluster pair, we found indication that the emission in-between the two subclusters has been enhanced during the encounter. We discussed the properties of the diffuse radio emission, considered as a whole, in relation to those of radio halos and the radio bridges in A399-A401 and A1758N-S, while acknowledging the uncertainties related to the unknown 3D separation, geometry and spectral index of the emission. In principle, the estimated emissivity and radio power would be in line with that expected by a diffuse emission generated by turbulence in an early phase before or after the collision. However, further observations are needed to confirm the assumptions of our analysis. On the one hand, new radio data are crucial to obtain a reliable measurement of the spectral index, as the upper limits derived from the available uGMRT data are not sufficiently constraining. On the other hand, optical and high-resolution SZ observations would help to clarify the system geometry, enabling a more thorough investigation of the physical properties of the emission.
To conclude, the newly discovered radio emission in G279+39 highlights the presence of nonthermal phenomena in-between a cluster pair, likely driven by turbulence injected during the cluster-cluster encounter. This work contributes to the growing effort to investigate the properties of diffuse radio emission in the Universe beyond the denser ICM regions typically probed by observations by targeting systems with multiple cluster components. This field is likely to flourish with the advent of next-generation facilities, with the SKA leading the way.
Acknowledgments
We thank the referee for the thoughtful comments on the merger scenario and Gianfranco Brunetti, Kosuke Nishiwaki, and John ZuHone for valuable discussion. The MeerKAT telescope is operated by the South African Radio Astronomy Observatory, which is a facility of the National Research Foundation, an agency of the Department of Science and Innovation. We thank the staff of the GMRT for support. GMRT is run by the National Centre for Radio Astrophysics of the Tata Institute of Fundamental Research. This research made use of the LOFAR-IT computing infrastructure supported and operated by INAF, including the resources within the PLEIADI special “LOFAR” project by USC-C of INAF, and by the Physics Dept. of Turin University (under the agreement with Consorzio Interuniversitario per la Fisica Spaziale) at the C3S Supercomputing Centre, Italy. This work made use of the following PYTHON packages: APLpy (Robitaille & Bressert 2012), astropy (Astropy Collaboration 2022), CMasher (van der Velden 2020), matplotlib (Hunter 2007), and numpy (van der Walt et al. 2011).
References
- Akamatsu, H., Gu, L., Shimwell, T. W., et al. 2016, A&A, 593, L7 [NASA ADS] [CrossRef] [EDP Sciences] [Google Scholar]
- Akamatsu, H., Fujita, Y., Akahori, T., et al. 2017, A&A, 606, A1 [NASA ADS] [CrossRef] [EDP Sciences] [Google Scholar]
- Alvarez, G. E., Randall, S. W., Su, Y., et al. 2022, ApJ, 938, 51 [NASA ADS] [CrossRef] [Google Scholar]
- Astropy Collaboration (Price-Whelan, A. M., et al.) 2022, ApJ, 935, 167 [NASA ADS] [CrossRef] [Google Scholar]
- Balboni, M., Gastaldello, F., Bonafede, A., et al. 2026, A&A, accepted [arXiv:2507.00133] [Google Scholar]
- Bonafede, A., Brunetti, G., Vazza, F., et al. 2021, ApJ, 907, 32 [Google Scholar]
- Bonjean, V., Aghanim, N., Salomé, P., Douspis, M., & Beelen, A. 2018, A&A, 609, A49 [NASA ADS] [CrossRef] [EDP Sciences] [Google Scholar]
- Botteon, A., Shimwell, T. W., Bonafede, A., et al. 2018, MNRAS, 478, 885 [Google Scholar]
- Botteon, A., Cassano, R., Eckert, D., et al. 2019a, A&A, 630, A77 [NASA ADS] [CrossRef] [EDP Sciences] [Google Scholar]
- Botteon, A., Shimwell, T. W., Bonafede, A., et al. 2019b, A&A, 622, A19 [NASA ADS] [CrossRef] [EDP Sciences] [Google Scholar]
- Botteon, A., Brunetti, G., van Weeren, R. J., et al. 2020a, ApJ, 897, 93 [Google Scholar]
- Botteon, A., van Weeren, R. J., Brunetti, G., et al. 2020b, MNRAS, 499, L11 [Google Scholar]
- Botteon, A., Shimwell, T. W., Cassano, R., et al. 2022, A&A, 660, A78 [NASA ADS] [CrossRef] [EDP Sciences] [Google Scholar]
- Botteon, A., van Weeren, R. J., Eckert, D., et al. 2024, A&A, 690, A222 [NASA ADS] [CrossRef] [EDP Sciences] [Google Scholar]
- Botteon, A., Balboni, M., Bartalucci, I., Gastaldello, F., & van Weeren, R. J. 2025, A&A, 698, A55 [NASA ADS] [CrossRef] [EDP Sciences] [Google Scholar]
- Briggs, D. S. 1995, Am. Astron. Soc. Meet. Abstr., 27, 1444 [Google Scholar]
- Brüggen, M., Reiprich, T. H., Bulbul, E., et al. 2021, A&A, 647, A3 [NASA ADS] [CrossRef] [EDP Sciences] [Google Scholar]
- Brunetti, G., & Jones, T. W. 2014, Int. J. Mod. Phys. D, 23, 30007 [Google Scholar]
- Brunetti, G., & Vazza, F. 2020, PRL, 124, 51101 [Google Scholar]
- Bruno, L., Brunetti, G., Botteon, A., et al. 2023, A&A, 672, A41 [NASA ADS] [CrossRef] [EDP Sciences] [Google Scholar]
- Bulbul, E., Randall, S. W., Bayliss, M. B., et al. 2016, ApJ, 818, 131 [Google Scholar]
- Caglar, T. 2018, MNRAS, 475, 2870 [NASA ADS] [CrossRef] [Google Scholar]
- Caglar, T., & Hudaverdi, M. 2017, MNRAS, 472, 2633 [NASA ADS] [CrossRef] [Google Scholar]
- Cassano, R., Ettori, S., Brunetti, G., et al. 2013, ApJ, 777, 141 [Google Scholar]
- Chandra, P., Ray, A., & Bhatnagar, S. 2004, ApJ, 612, 974 [Google Scholar]
- Churazov, E., Khabibullin, I. I., Lyskova, N., Sunyaev, R., & Bykov, A. M. 2021, A&A, 651, A41 [NASA ADS] [CrossRef] [EDP Sciences] [Google Scholar]
- Cuciti, V., Cassano, R., Brunetti, G., et al. 2021, A&A, 647, A51 [EDP Sciences] [Google Scholar]
- Cuciti, V., Cassano, R., Sereno, M., et al. 2023, A&A, 680, A30 [NASA ADS] [CrossRef] [EDP Sciences] [Google Scholar]
- David, L. P., & Kempner, J. C. 2004, ApJ, 613, 831 [Google Scholar]
- de Jong, J. M., van Weeren, R. J., Botteon, A., et al. 2022, A&A, 668, A107 [NASA ADS] [CrossRef] [EDP Sciences] [Google Scholar]
- Dey, A., Schlegel, D. J., Lang, D., et al. 2019, AJ, 157, 168 [Google Scholar]
- Döner, S., Caglar, T., Smith, K. L., et al. 2025, ApJ, submitted [Google Scholar]
- Donnert, J. M., Dolag, K., Brunetti, G., & Cassano, R. 2013, MNRAS, 429, 3564 [Google Scholar]
- Duchesne, S. W., Johnston-Hollitt, M., Offringa, A. R., et al. 2021a, PASA, 38, e010 [NASA ADS] [CrossRef] [Google Scholar]
- Duchesne, S. W., Johnston-Hollitt, M., & Wilber, A. G. 2021b, PASA, 38, e031 [NASA ADS] [CrossRef] [Google Scholar]
- Duchesne, S. W., Botteon, A., Koribalski, B. S., et al. 2024, PASA, 41, e026 [NASA ADS] [CrossRef] [Google Scholar]
- George, L. T., Kale, R., & Wadadekar, Y. 2021, Exp. Astron., 51, 235 [CrossRef] [Google Scholar]
- Govoni, F., Orrù, E., Bonafede, A., et al. 2019, Science, 364, 981 [Google Scholar]
- Gu, L., Akamatsu, H., Shimwell, T. W., et al. 2019, Nat. Ast., 3, 838 [Google Scholar]
- Gupta, Y., Ajit Kumar, B., Kale, H. S., et al. 2017, Curr. Sci., 113, 707 [NASA ADS] [CrossRef] [Google Scholar]
- Hincks, A. D., Radiconi, F., Romero, C. E., et al. 2022, MNRAS, 510, 3335 [NASA ADS] [CrossRef] [Google Scholar]
- Hoeft, M., Dumba, C., Drabent, A., et al. 2021, A&A, 654, A68 [NASA ADS] [CrossRef] [EDP Sciences] [Google Scholar]
- Hu, D., Werner, N., Xu, H., et al. 2025, A&A, 694, A320 [NASA ADS] [CrossRef] [EDP Sciences] [Google Scholar]
- Hunter, J. D. 2007, Comput. Sci. Eng., 9, 90 [NASA ADS] [CrossRef] [Google Scholar]
- Iapichino, L., Adamek, J., Schmidt, W., & Niemeyer, J. C. 2008, MNRAS, 388, 1079 [NASA ADS] [CrossRef] [Google Scholar]
- Intema, H. T., van der Tol, S., Cotton, W. D., et al. 2009, A&A, 501, 1185 [NASA ADS] [CrossRef] [EDP Sciences] [Google Scholar]
- Johnston-Hollitt, M., & Pratley, L. 2017, ArXiv e-prints [arXiv:1706.04930] [Google Scholar]
- Jonas, J. L. 2009, IEEE Proc., 97, 1522 [Google Scholar]
- Kato, Y., Nakazawa, K., Gu, L., et al. 2015, PASJ, 67, 71 [NASA ADS] [CrossRef] [Google Scholar]
- Kaya, H. I., Caglar, T., & Sert, H. 2019, MNRAS, 485, 4550 [Google Scholar]
- Kim, K.-T., Kronberg, P. P., Giovannini, G., & Venturi, T. 1989, Nature, 341, 720 [NASA ADS] [CrossRef] [Google Scholar]
- Knowles, K., Cotton, W. D., Rudnick, L., et al. 2022, A&A, 657, A56 [NASA ADS] [CrossRef] [EDP Sciences] [Google Scholar]
- Machado, R. E. G., Volert, R. C., Albuquerque, R. P., Monteiro-Oliveira, R., & Lima Neto, G. B. 2024, ApJ, 970, 160 [Google Scholar]
- Migkas, K., Sommer, M. W., Schrabback, T., et al. 2025, A&A, 694, A45 [NASA ADS] [CrossRef] [EDP Sciences] [Google Scholar]
- Mirakhor, M. S., Walker, S. A., & Runge, J. 2022, MNRAS, 509, 1109 [Google Scholar]
- Mirakhor, M. S., Walker, S. A., & Runge, J. 2023, MNRAS, 522, 2105 [Google Scholar]
- Murgia, M., Govoni, F., Vacca, V., et al. 2024, MNRAS, 528, 6470 [Google Scholar]
- Nunhokee, C. D., Bernardi, G., Manti, S., et al. 2023, MNRAS, 522, 4421 [CrossRef] [Google Scholar]
- Offringa, A. R. 2016, A&A, 595, A99 [NASA ADS] [CrossRef] [EDP Sciences] [Google Scholar]
- Offringa, A. R., & Smirnov, O. M. 2017, MNRAS, 471, 301 [Google Scholar]
- Offringa, A. R., de Bruyn, A. G., Biehl, M., et al. 2010, MNRAS, 405, 155 [NASA ADS] [Google Scholar]
- Offringa, A. R., van de Gronde, J. J., & Roerdink, J. B. 2012, A&A, 539, A95 [NASA ADS] [CrossRef] [EDP Sciences] [Google Scholar]
- Offringa, A. R., McKinley, B., Hurley-Walker, N., et al. 2014, MNRAS, 444, 606 [Google Scholar]
- Omiya, Y., Nakazawa, K., Matsushita, K., et al. 2023, PASJ, 75, 37 [NASA ADS] [CrossRef] [Google Scholar]
- Pignataro, G., Bonafede, A., Bernardi, G., et al. 2024a, A&A, 691, A99 [NASA ADS] [CrossRef] [EDP Sciences] [Google Scholar]
- Pignataro, G., Bonafede, A., Bernardi, G., et al. 2024b, A&A, 685, L10 [NASA ADS] [CrossRef] [EDP Sciences] [Google Scholar]
- Pignataro, G., Bonafede, A., Bernardi, G., et al. 2024c, A&A, 682, A105 [NASA ADS] [CrossRef] [EDP Sciences] [Google Scholar]
- Planck Collaboration XXII. 2016, A&A, 594, A22 [NASA ADS] [CrossRef] [EDP Sciences] [Google Scholar]
- Rajpurohit, K., Botteon, A., O’Sullivan, E., et al. 2025, ApJ, 992, 88 [Google Scholar]
- Reddy, S. H., Kudale, S., Gokhale, U., et al. 2017, J. Astron. Instrum., 6, 1641011 [CrossRef] [Google Scholar]
- Robitaille, T. P., & Bressert, E. 2012, Astrophysics Source Code Library [record ascl:1208.017] [Google Scholar]
- Roettiger, K., Loken, C., & Burns, J. O. 1997, ApJS, 109, 307 [NASA ADS] [CrossRef] [Google Scholar]
- Roettiger, K., Stone, J. M., & Burns, J. O. 1999, ApJ, 518, 594 [NASA ADS] [CrossRef] [Google Scholar]
- Roy, J., Gupta, Y., Pen, U.-L., et al. 2010, Exp. Astron., 28, 25 [Google Scholar]
- Sakelliou, I., & Ponman, T. J. 2004, MNRAS, 351, 1439 [NASA ADS] [CrossRef] [Google Scholar]
- Sikhosana, S. P., Hilton, M., Bernardi, G., et al. 2025, A&A, 698, L17 [NASA ADS] [CrossRef] [EDP Sciences] [Google Scholar]
- Stuardi, C., Botteon, A., Sereno, M., et al. 2025, A&A, 695, L16 [NASA ADS] [CrossRef] [EDP Sciences] [Google Scholar]
- van der Velden, E. 2020, J. Open Source Softw., 5, 2004 [Google Scholar]
- van der Walt, S. J., Colbert, S. C., & Varoquaux, G. 2011, Comput. Sci. Eng., 13, 22 [NASA ADS] [CrossRef] [Google Scholar]
- van Diepen, G., Dijkema, T. J., & Offringa, A. R. 2018, Astrophysics Source Code Library [record ascl:1804.003] [Google Scholar]
- van Weeren, R. J., de Gasperin, F., Akamatsu, H., et al. 2019, Space Sci. Rev., 215, 16 [Google Scholar]
- van Weeren, R. J., Shimwell, T. W., Botteon, A., et al. 2021, A&A, 651, A115 [NASA ADS] [CrossRef] [EDP Sciences] [Google Scholar]
- van Weeren, R. J., Osinga, E., Brunetti, G., et al. 2026, MNRAS, accepted [Google Scholar]
- Vazza, F., Jones, T. W., Brüggen, M., et al. 2017, MNRAS, 464, 210 [Google Scholar]
- Vazza, F., Ettori, S., Roncarelli, M., et al. 2019, A&A, 627, A5 [NASA ADS] [CrossRef] [EDP Sciences] [Google Scholar]
- Venturi, T., Giacintucci, S., Merluzzi, P., et al. 2022, A&A, 660, A81 [NASA ADS] [CrossRef] [EDP Sciences] [Google Scholar]
- Werner, N., Finoguenov, A., Kaastra, J. S., et al. 2008, A&A, 482, L29 [NASA ADS] [CrossRef] [EDP Sciences] [Google Scholar]
- XRISM Collaboration (Audard, M., et al.) 2025a, PASJ, 77, 1278 [Google Scholar]
- XRISM Collaboration (Audard, M., et al.) 2025b, ApJ, 982, L5 [Google Scholar]
- XRISM Collaboration (Audard, M., et al.) 2025c, ApJ, 985, L20 [Google Scholar]
- XRISM Collaboration (Audard, M., et al.) 2025d, PASJ, 77, S242 [Google Scholar]
- XRISM Collaboration (Audard, M., et al.) 2025e, Nature, 638, 365 [Google Scholar]
- ZuHone, J. A., Kowalik, K., Öhman, E., Lau, E. T., & Nagai, D. 2018, ApJS, 234, 4 [NASA ADS] [CrossRef] [Google Scholar]
We refer to the “radio halos only” BCES Y|X fit of the statistical sample.
Appendix A: Additional radio images
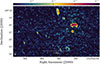 |
Fig. A.1. uGMRT radio image at 400 MHz with a beam of 8.3″ × 4.5″ (shown in the bottom left corner) and a noise of σrms = 28 μJy beam−1. The color bar units are Jansky beam−1. |
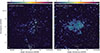 |
Fig. A.2. Large-FoV source-subtracted images of G279+39. Left: uGMRT 400 MHz image at 16.4″ × 10.8″ resolution with a noise of 44 μJy beam−1. Right: MeerKAT 822 MHz image at 16.8″ × 16.3″ resolution with a noise of 6.3 μJy beam−1 (the same of Fig. 3, top panel). Solid contours are spaced by a factor of 2 from the 3σrms level. The −3σrms contour is shown in dashed. The beams are shown in the bottom left corners. The color bar units are Jansky beam−1. |
All Figures
|
Fig. 1. Multiband view of G279+39. Top: Optical g,r,z image from the DESI Legacy Imaging Surveys (Dey et al. 2019). Center: X-ray adaptively smoothed image in the 0.5–2.0 keV band with point sources removed (Döner et al. 2025). Bottom: MeerKAT radio image at 822 MHz with a beam of 9.0″ × 8.0″ (shown in the bottom left corner) and a noise of σrms = 4.7 μJy beam−1. The cross and diamond markers indicate the position of the galaxies mentioned in the text. The color bar units are counts s−1 for the X-ray image and Jansky beam−1 for the radio image. |
| In the text | |
|
Fig. 2. Highlighting the diffuse radio emission excess in G279+39. Top panels: MeerKAT images obtained by imaging all baselines (left, same as in Fig. 1) and only baselines longer than 1500λ (right). Bottom panel: Fractional difference image, computed by subtracting the top right image from the top left image and dividing the result by the former. |
| In the text | |
|
Fig. 3. Source-subtracted low-resolution MeerKAT images at 822 MHz. Top: Image produced by subtracting compact sources in the uv plane and reimaging the visibilities with a Gaussian taper, yielding a beam of 16.8″ × 16.3″ and a noise of σrms = 6.3 μJy beam−1. The yellow ellipse denotes the region used to extract the flux densities of the diffuse emission. Bottom: Image obtained by subtracting compact sources in the image plane at high resolution, then convolving the result to the same 16.8″ × 16.3″ beam. Solid contours are spaced by a factor of 2 from the 3σrms level. The −3σrms contour is shown in dashed. The beams are shown in the bottom left corners. The color bar units are Jansky beam−1. |
| In the text | |
|
Fig. 4. X-ray image with the MeerKAT low-resolution radio contours with sources subtracted in the uv plane overlaid. The beam of the radio image is shown in the bottom left corner. |
| In the text | |
|
Fig. 5. Flux density profile across the cluster pair from east to west integrated above the 3σrms level and over the entire rectangular regions (see legend). The solid lines were obtained by fitting an exponential decaying model to the data points on the side away from the opposite cluster, starting from the emission peak. The dashed lines represent the mirrored model toward the other cluster. |
| In the text | |
|
Fig. A.1. uGMRT radio image at 400 MHz with a beam of 8.3″ × 4.5″ (shown in the bottom left corner) and a noise of σrms = 28 μJy beam−1. The color bar units are Jansky beam−1. |
| In the text | |
|
Fig. A.2. Large-FoV source-subtracted images of G279+39. Left: uGMRT 400 MHz image at 16.4″ × 10.8″ resolution with a noise of 44 μJy beam−1. Right: MeerKAT 822 MHz image at 16.8″ × 16.3″ resolution with a noise of 6.3 μJy beam−1 (the same of Fig. 3, top panel). Solid contours are spaced by a factor of 2 from the 3σrms level. The −3σrms contour is shown in dashed. The beams are shown in the bottom left corners. The color bar units are Jansky beam−1. |
| In the text | |
Current usage metrics show cumulative count of Article Views (full-text article views including HTML views, PDF and ePub downloads, according to the available data) and Abstracts Views on Vision4Press platform.
Data correspond to usage on the plateform after 2015. The current usage metrics is available 48-96 hours after online publication and is updated daily on week days.
Initial download of the metrics may take a while.