Fig. 2.
Download original image
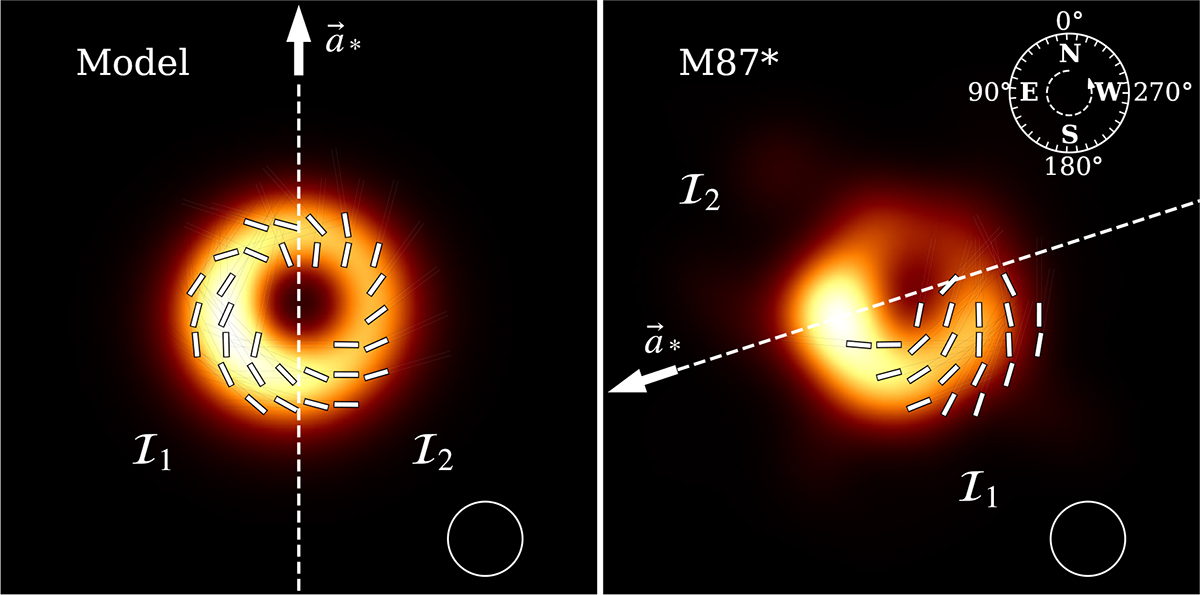
Left: Example of an RIAF model with a* > 0 ray-traced at an inclination of 163°, blurred with a 15 μas circular Gaussian, indicated with a circle in the bottom right corner, before the 108° counterclockwise rotation to match it with the observed appearance of the M 87*. The ticks indicate the direction of polarization, vector a∗ shows the observer’s screen projection of the BH spin vector pointing away from the observer (into the screen). Right: Image of M 87* reconstructed from the EHT 2017 observations (EHTC 2019d). The axis shows the observed position angle of the jet, with the forward jet appearing toward the west at about 288° (Walker et al. 2018). The arrow shows the expected direction of the BH spin projection, pointing away from the observer. The 15 μas effective resolution of the image is indicated with a circle in the bottom right corner. Polarization ticks are shown in the region where ℐ > 0.1ℐmax and ![]() , as shown in Fig. 1 of EHTC (2021b).
, as shown in Fig. 1 of EHTC (2021b).
Current usage metrics show cumulative count of Article Views (full-text article views including HTML views, PDF and ePub downloads, according to the available data) and Abstracts Views on Vision4Press platform.
Data correspond to usage on the plateform after 2015. The current usage metrics is available 48-96 hours after online publication and is updated daily on week days.
Initial download of the metrics may take a while.