Open Access
Fig. 2.
Download original image
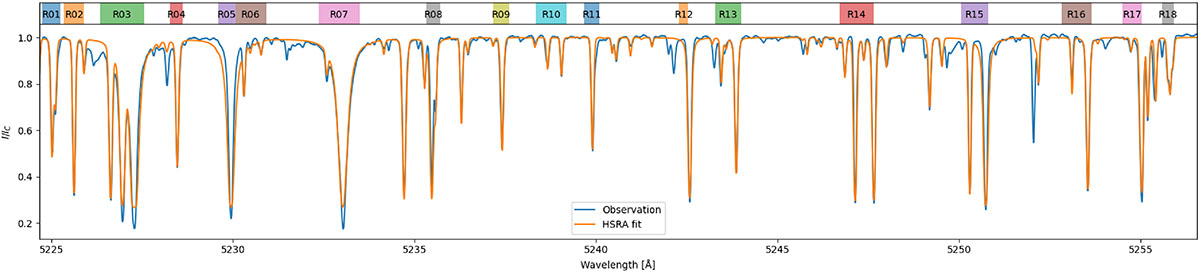
Comparison of the computed spectrum using the HSRA model with a normalized Stokes I profile from an averaged FISS-SP flat-field measurement. We allowed the code to adjust for microturbulence and temperature offset. The bar above the profile indicates the spectral windows R01–R18 from Table 2.
Current usage metrics show cumulative count of Article Views (full-text article views including HTML views, PDF and ePub downloads, according to the available data) and Abstracts Views on Vision4Press platform.
Data correspond to usage on the plateform after 2015. The current usage metrics is available 48-96 hours after online publication and is updated daily on week days.
Initial download of the metrics may take a while.