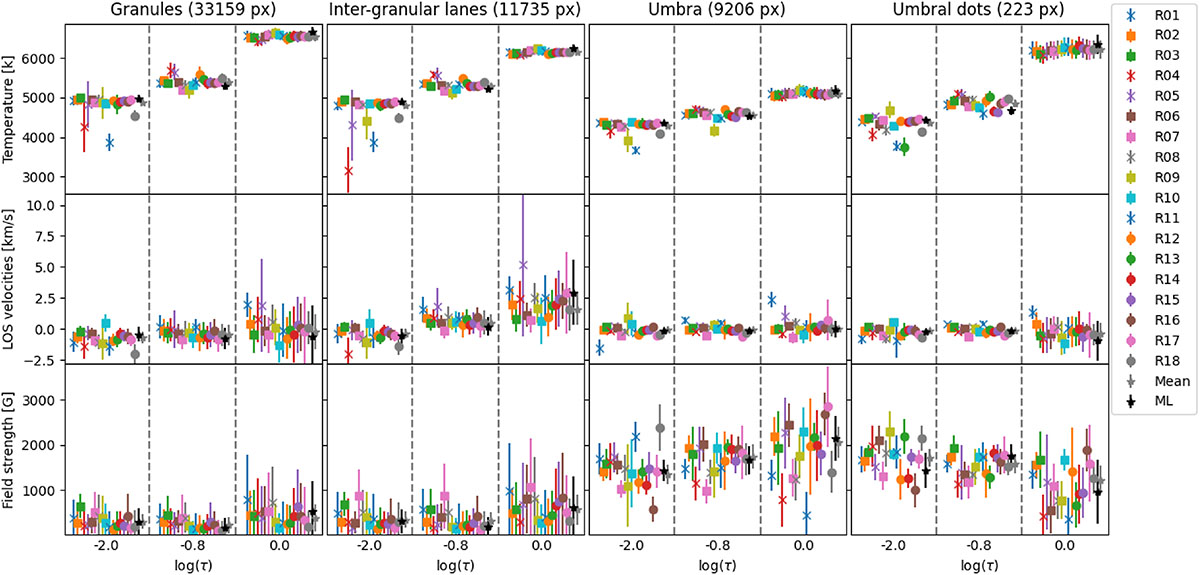
Fig. 3.
Download original image
Comparison of atmospheric parameters deduced from the 18 selected spectral windows (see Table 2), separated by type of solar feature. The main columns show properties of granules, inter-granular lanes, bright points, umbra, and umbral dots. Each column is sub-divided by dashed lines into the values of the parameters at the different optical depth nodes. Each row refers to one atmospheric parameter (temperature, LOS velocities, and field strength). Each spectral window is represented by a symbol, indicating the mean value of the retrieved parameter from all pixels corresponding to the given physical parameter, and a range bar, indicating the standard deviation. The excluded windows are marked with an ×-symbol. The gray entry indicates the mean of the finally used 14 spectral windows and the black entry the result from the simultaneous many-line inversion (see main text for a detailed discussion).
Current usage metrics show cumulative count of Article Views (full-text article views including HTML views, PDF and ePub downloads, according to the available data) and Abstracts Views on Vision4Press platform.
Data correspond to usage on the plateform after 2015. The current usage metrics is available 48-96 hours after online publication and is updated daily on week days.
Initial download of the metrics may take a while.