Fig. 5.
Download original image
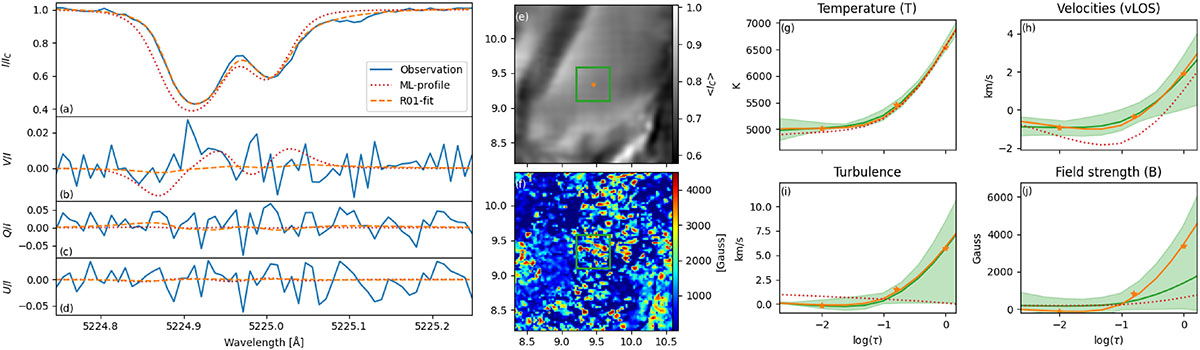
Typical fit and stratification for the blended region R01 including ten spectral lines for a selected granulation pixel. Panels (a–d): Observation, and synthetic profiles in Stokes I, V, Q, and U in relative values of I. The R01 profile corresponds to the inversion result from the individual inversion of this region, while the ML profile was synthesized using the atmospheric configuration extracted from the many-line inversion result (see Section 5). Panels (e–f): Continuum image (e) of the granule with the selected pixel marked by the orange plus sign (+) and the corresponding map of the magnetic field strength (f) in the log(τ) = 0 node. Panels (g–j): Derived stratification for temperature (g), vLOS (h), turbulence (i) and field strength (j). The values at the log(τ ) nodes are indicated with a symbol, the line represents the spline fit. Orange is the stratification for the selected pixel from the inversion result, green shows the mean and range of the values from the green box indicated in the middle panel, and red shows the stratification for the many-line atmosphere of the selected pixel.
Current usage metrics show cumulative count of Article Views (full-text article views including HTML views, PDF and ePub downloads, according to the available data) and Abstracts Views on Vision4Press platform.
Data correspond to usage on the plateform after 2015. The current usage metrics is available 48-96 hours after online publication and is updated daily on week days.
Initial download of the metrics may take a while.