Fig. 1.
Download original image
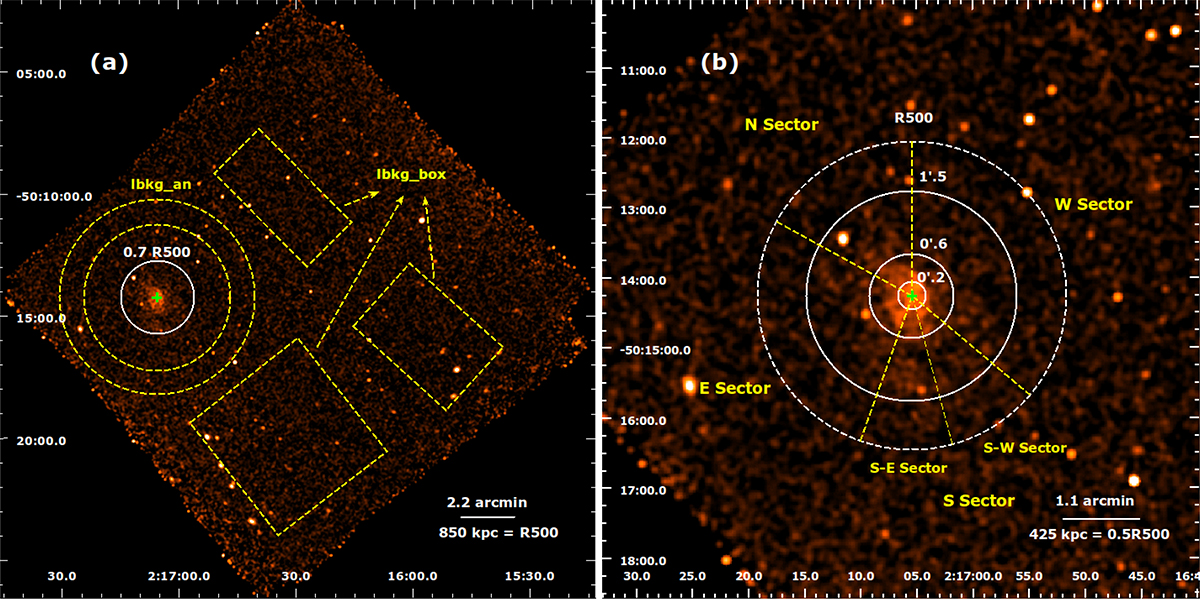
Exposure-corrected 0.5−7 keV Chandra ACIS-I0–3 image of SPT-CL J0217−5014. (a) Full Chandra ACIS-I field-of-view image of the cluster. The source extraction region, centred on the X-ray centroid, is shown by a white circle with a radius of ![]() (∼0.7 R500). The regions used for local background extraction are also indicated. All point sources were excluded from the source and background regions during imaging and spectral analysis. (b) Zoomed-in view of the cluster core. The annuli used for radial analysis with radii of
(∼0.7 R500). The regions used for local background extraction are also indicated. All point sources were excluded from the source and background regions during imaging and spectral analysis. (b) Zoomed-in view of the cluster core. The annuli used for radial analysis with radii of ![]() ,
, ![]() , and
, and ![]() are shown together with the four sectors used to extract surface brightness profiles. The S sector is further divided into two equal sectors.
are shown together with the four sectors used to extract surface brightness profiles. The S sector is further divided into two equal sectors.
Current usage metrics show cumulative count of Article Views (full-text article views including HTML views, PDF and ePub downloads, according to the available data) and Abstracts Views on Vision4Press platform.
Data correspond to usage on the plateform after 2015. The current usage metrics is available 48-96 hours after online publication and is updated daily on week days.
Initial download of the metrics may take a while.