| Issue |
A&A
Volume 705, January 2026
|
|
|---|---|---|
| Article Number | A137 | |
| Number of page(s) | 11 | |
| Section | Cosmology (including clusters of galaxies) | |
| DOI | https://doi.org/10.1051/0004-6361/202556907 | |
| Published online | 14 January 2026 | |
A Chandra view of SPT-CL J0217–5014: A massive galaxy cluster at a cosmic intersection at z = 0.53
1
Department of Theoretical Physics and Astrophysics, Faculty of Science, Masaryk University Kotlářská 2 Brno 611 37, Czech Republic
2
School of Physics and Astronomy, Shanghai Jiao Tong University Dongchuan Road 800 Shanghai 200240, China
3
National Astronomical Observatories, Chinese Academy of Sciences 20A Datun Road Beijing 100101, PR China
4
Department of Astronomy, Tsinghua University Beijing 100084, PR China
5
Department of Physics and Astronomy, University of Kentucky 505 Rose Street Lexington KY 40506, USA
6
NASA Goddard Space Flight Center, Code 662 Greenbelt MD 20771, USA
7
SRON Netherlands Institute for Space Research Niels Bohrweg 4 2333 CA Leiden, The Netherlands
★ Corresponding authors: This email address is being protected from spambots. You need JavaScript enabled to view it.
, This email address is being protected from spambots. You need JavaScript enabled to view it.
Received:
19
August
2025
Accepted:
3
December
2025
Abstract
Context. Galaxy clusters trace the densest regions of the cosmic web and are crucial laboratories for studying the thermodynamic and chemical evolution of the intracluster medium (ICM). The massive galaxy cluster SPT-CL J0217−5014 (z ∼ 0.53; M500 ∼ 3 × 10¹⁴ M⊙) is one of the Swift X-Ray Telescope serendipitous galaxy clusters with the highest reported Fe abundance (∼1.3 ± 0.4 Z⊙ within ∼ 1.′7) and a potentially disturbed morphology.
Aims. SPT-CL J0217−5014 presents an intriguing opportunity to investigate ICM chemical enrichment and cool-core survival. With this study, we aim to evaluate its chemical and thermodynamic properties with a dedicated Chandra observation.
Methods. Using new Chandra observations, we derived surface brightness profiles and dynamical state parameters. We also performed spectral fitting using different backgrounds to constrain the Fe abundance. We performed joint analysis of the X-ray surface brightness, temperature, and integrated Sunyaev-Zel’dovich Compton parameter to constrain the density profile. The DESI optical galaxy cluster catalogue was examined to explore its large-scale environment.
Results. The X-ray morphology reveals a disturbed ICM with a surface brightness edge at ∼ 0.′26 (∼100 kpc) to the west and a tail-like feature extending towards the east. The best-fit metal abundance within  (∼0.7 R500) is 0.61+0.26−0.23 Z⊙. The derived central electron number density, entropy, and cooling time classify this system as a non-cool-core cluster, suggesting that merger activity has likely disrupted the possible pre-existing cool core. At larger radii (∼1′−2′), we detected excess X-ray emission to the south spatially aligned with a filamentary distribution of red galaxies, indicating ongoing accretion along an intracluster filament. Based on the DESI DR9 cross-matched optical clusters and photometric redshifts, we identified three nearby lower-mass clusters that likely trace the large-scale structures, suggesting that SPT-CL J0217−5014 is the primary node of a dynamically active environment where past mergers and anisotropic accretion along cosmic filaments have shaped the present-day ICM.
Key words: galaxies: clusters: general / galaxies: clusters: intracluster medium / X-rays: galaxies: clusters / galaxies: clusters: individual: SPT-CL J0217–5014
© The Authors 2026
 Open Access article, published by EDP Sciences, under the terms of the Creative Commons Attribution License (https://creativecommons.org/licenses/by/4.0), which permits unrestricted use, distribution, and reproduction in any medium, provided the original work is properly cited.
This article is published in open access under the Subscribe to Open model. This email address is being protected from spambots. You need JavaScript enabled to view it. to support open access publication.
1. Introduction
Galaxy clusters, the most massive gravitationally bound systems in the Universe, are thought to form at the intersections of filaments within the cosmic web. They grow through mergers and the accretion of surrounding lower-mass systems (e.g. Kravtsov & Borgani 2012). These assembly processes, driven by the gravitational collapse and merger-induced energy release, heat the intracluster medium (ICM) to temperatures exceeding 107 K, producing thermal bremsstrahlung radiation that dominates in the X-ray band (e.g. Sarazin 1986; Böhringer & Werner 2010).
Observations and simulations suggest that proto-clusters or early-stage galaxy cluster assemblies were already in place at redshifts z ∼ 2 − 7 (e.g. Daddi et al. 2009; Chiang et al. 2013; Miller et al. 2018; Esposito et al. 2025). Within these structures, galaxies experienced intense starburst activities, leading to the formation of massive stars that exploded as core-collapse supernovae (SNcc) on timescales of ∼106 − 107 yr. These supernovae enriched the surrounding medium with α-elements (e.g. O, Mg; Nomoto et al. 2013), which were subsequently dispersed outwards by active galactic nucleus (AGN) feedback, supernova-driven winds, and stellar winds (see Biffi et al. 2018, for a review). Over time, this metal-enriched gas mixed into the ICM, resulting in a flat and uniform metallicity distribution in cluster outskirts, typically around 0.3 Z⊙ (e.g. Fujita et al. 2008; Werner et al. 2013; Simionescu et al. 2015; Urban et al. 2017; Mernier et al. 2018; Lovisari & Reiprich 2019).
At lower redshifts (z < 1), galaxy clusters are believed to approach virial equilibrium. During this phase, the central brightest cluster galaxy (BCG) could play an important role in enriching the ICM via stellar mass loss (Böhringer et al. 2004; Werner et al. 2006; Mao et al. 2019) and supernova explosions (Werner et al. 2008; Mernier et al. 2018), with feedback from the AGN in the BCG helping distribute iron enriched gas throughout the cluster core. Interestingly, most clusters exhibiting prominent central iron peaks are found to be cool-core systems (e.g. De Grandi & Molendi 2001; Ettori et al. 2015; McDonald et al. 2016; Mantz et al. 2017; Lovisari & Reiprich 2019; Liu et al. 2020), as their dense, low-entropy gas suppresses turbulent mixing and efficiently retains enriched material in the centre. Minor mergers may induce gentle gas sloshing that redistributes metals within the core region, but such events generally do not erase the central peak (e.g. Roediger et al. 2011; Ghizzardi et al. 2014; Hu et al. 2019). While major mergers or powerful AGN outbursts have the potential to disrupt the core and flatten the metallicity gradient, whether a major merger can fully erase the central metallicity peak remains debated. Some simulation studies suggest that the peak can survive or become re-established on timescales of gigayears, depending on the merger geometry and feedback history (e.g. Vogelsberger et al. 2018; Valdarnini & Sarazin 2021). Furthermore, some statistical analyses of cluster samples across a wide redshift range (0 < z < 1.5) suggest a mild increase in central iron abundance from z ∼ 1 to z ∼ 0 (e.g. Ettori et al. 2015; Mantz et al. 2017; Liu et al. 2020). This trend supports the interpretation that the central abundance peak results from long-term, sustained enrichment from the BCG combined with the stable, dense environment of cool-core clusters. However, these samples are dominated by low-redshift systems (z < 0.3), and robust measurements at z > 0.5 remain limited.
A particularly notable example is WARP J1415.1+3612 at z ∼ 1, which was found to host a well-developed cool core and an exceptionally high central abundance of ZFe = 3.6 Z⊙ within r < 12 kpc, along with evidence of star formation (2 − 8 M⊙ yr−1) and AGN activity (L1.4 GHz = 2 × 1025 W Hz−1) in its BCG (Santos et al. 2012). This discovery indicated that the ICM was rapidly enriched by early star formation in the BCG at z > 1 and feedback processes were already in place at z ∼ 1. De Grandi et al. (2014) confirmed the presence of a central iron excess in the WARP J1415.1+3612 cluster and further proposed that this iron excess resulted from early and intense star formation that happened around z ∼ 3, followed by SNIa explosions on a very short timescale (∼0.04 Gyr).
Similarly, one of the Swift X-Ray Telescope (XRT) serendipitous galaxy clusters, SPT-CL J0217−5014, was reported to exhibit a high gas temperature (∼8.0 ± 1.0 keV) and super-solar iron abundance (∼1.3 ± 0.4 Z⊙) within  (∼0.8 R500; Tozzi et al. 2014). It was also determined to have a redshift of z ∼ 0.52 ± 0.01 by fitting the Fe Kα line complex, which is consistent with other redshift estimates from optical observations (Bleem et al. 2015; Bocquet et al. 2019; Zou et al. 2021, 2022). The detection of high abundance over a large radial scale (∼0.8 R500) suggests that the cluster SPT-CL J0217−5014 may be an outlier compared to the typical redshift-abundance trend derived from central (0 − 0.1 R500) or intermediate (0.1 − 0.5 R500) regions (Ettori et al. 2015; Mantz et al. 2017; Liu et al. 2020). In addition, the dynamical state and thermodynamic distribution of this galaxy cluster both remain poorly understood. To confirm whether this serendipitously discovered cluster indeed has a high abundance, thus potentially providing us with a ‘J1415.1+3612-like’ target, and to deepen our understanding of this source, we obtained a first Chandra observation with an exposure time of about 100 ks (PI: J. Mao). The cluster’s mass, derived from Sunyaev–Zel’dovich (SZ) effect measurements, is estimated to be M500 ∼ 3 × 10¹⁴ M⊙ (Bleem et al. 2015; Bocquet et al. 2019). According to the photometric redshift (z = 0.53 ± 0.01) of the BCG of SPT-CL J0217−5014 from DESI DR9 data (Zou et al. 2022), R500, where the enclosed matter density is 500 times the critical density at this redshift, is estimated as 850 kpc when adopting
  , where ρc(z) = 3H(z)2/8πG is the critical density.
Throughout this work, we adopt a standard flat Λ cold dark matter cosmology with Ωm = 0.27, Ωλ = 0.73, and a Hubble constant of H0 = 70 km s−1 Mpc−1. At the redshift of SPT-CL J0217−5014 (z = 0.53), the angular scale of the target is ∼6.36 kpc/arcsec, and the angular diameter distance and luminosity distance are 1312 Mpc and 3072 Mpc, respectively. Unless otherwise stated, we adopt the solar abundance standards of Wilms et al. (2000) and quote errors at the 68% confidence level.
2. Chandra observations and data reduction
SPT-CL J0217−5014 was observed with the Advanced CCD Imaging Spectrometer (ACIS)-I array on board Chandra during three pointing observations performed on March 11 (ObsID: 21538; 45.5 ks), March 17 (ObsID: 23045; 29.7 ks), and March 18, 2020 (ObsID: 23191; 30.7 ks). For each observation, the data were reduced following the standard procedure, as suggested by the Chandra X-ray Center, using the Chandra Interactive Analysis of Observations (CIAO; Fruscione et al. 2006) v4.16.0 and Chandra Calibration Database (CALDB) v4.10.2. A detailed description of the data reduction procedure is provided in Hu et al. (2019, 2021), but we briefly discuss several main steps here. First, we used the CIAO script chandra_repro to reprocess level 1 event files by applying the latest calibration files and producing new bad pixel maps. Then we applied the CIAO tool wavdetect with scale parameters of 1.0, 2.0, 4.0, 8.0, 16.0, and 24.0 and the significance threshold (sigthresh) of 10−6 to identify and exclude all the point sources detected in the ACIS images for each observation. All the detected point sources were confirmed by visual inspection. We then examined the light curves extracted in the 0.5 − 12.0 keV band from the source-free region. We excluded the time intervals contaminated by occasional particle background flares where the count rate deviates from the mean value by more than 20%. The final total clean exposure time of these three observations is 104.5 ks.
Three types of background files, namely, blank-sky background, stowed background, and local background, were used in this work. The blank-sky background represents composite observations of relatively empty sky fields with point sources removed, combining both the X-ray sky background and instrumental background. The stowed background represents the pure particle-induced instrumental background obtained when the ACIS detector is positioned away from the telescope’s focal plane and shielded from all sky X-rays. The background files were obtained using the CIAO script blanksky. Two sets of local background regions were selected for each observation: one from an annular region (3′−4′) and the other from three box regions away from the source – shown in Fig. 1a.
 |
Fig. 1. Exposure-corrected 0.5−7 keV Chandra ACIS-I0–3 image of SPT-CL J0217−5014. (a) Full Chandra ACIS-I field-of-view image of the cluster. The source extraction region, centred on the X-ray centroid, is shown by a white circle with a radius of |


In this work, the spectra with the appropriate ancillary response files (ARFs) and redistribution matrix files (RMFs) were extracted using the CIAO tool specextract and fitted by using XSPEC v12.13.0 (Arnaud 1996) and ATOMDB v3.0.9 (Smith et al. 2001; Foster et al. 2012).
3. X-ray imaging analysis
3.1. X-ray surface brightness distributions
The exposure-corrected 0.5 − 7 keV ACIS I0-3 image of SPT-CL J0217−5014 generated using data from the three Chandra observations and the CIAO tool merge_obs is shown in Fig. 1. The image was smoothed with a Gaussian kernel of 5 pixels. The X-ray centroid was estimated within a circular region of radius  and is located at RA = 02h 17m 05.39s, Dec = −50° 14′ 16.2″ (J2000.0), indicated with the cross in Fig. 1. The position of the BCG is RA = 02h17m05.50s, Dec = −50° 14′ 16.44″ (J2000.0), with an offset of only ∼1″ from the X-ray centroid. We note that no diffuse radio emission has been detected in SPT-CL J0217−5014 with the current radio surveys, possibly due to their limited sensitivity and poor integrated observation time. However, the central AGN associated with the BCG is detected in the Rapid ASKAP Continuum Survey (RACS) at 1367.5 MHz, with a radio luminosity of L1.37 GHz = 1.3 × 1024 W Hz−1 (Duchesne et al. 2024).
Within the inner region ( ; see Fig. 1b), the X-ray emission shows an asymmetric morphology with several potential substructures, including an arc-shaped edge west of the cluster centre. To obtain a basic understanding of the X-ray surface brightness distribution of SPT-CL J0217−5014, we extracted surface brightness profiles from a set of azimuthally averaged (full 360°) regions and from sector regions in four directions (Fig. 1). The resulting surface brightness profiles are shown in Fig. 2. Overall, the surface brightness decreases outwards and approaches the background level beyond
  (∼0.7 R500). We used a single-β model to fit the azimuthally averaged surface brightness profile using PYPROFFIT (Eckert et al. 2020) with a form of
 |
Fig. 2. Radial surface brightness profiles extracted from a set of azimuthally averaged (full 360°) regions and from sector regions in four different directions, as indicated in the legend of each panel. The best-fit single-β model for the azimuthally averaged surface brightness profile and the best-fit background parameter are also presented in all panels. The best-fit projected broken power-law model for the western surface brightness profile is presented in the top-right panel. |
 (1)
(1)
where  is the core radius, β = 0.58 ± 0.06 is the slope, S0 = (7.7 ± 1.0)×10−5 cts s−1 arcmin−2 cm−2 is the normaliztion, and Sbkg = (1.72 ± 0.02)×10−5 cts s−1 arcmin−2 cm−2 is the background. The best-fit result is shown in Fig. 2 and indicates that there is no obvious excess at the cluster core.
Along the western direction, an edge (W edge) is obvious at  (∼77 kpc), possibly corresponding to the cold front (or cool core). To characterise the W edge, the W surface brightness profile was modelled by a projected three-dimensional density profile implemented in PYPROFFIT with a broken power-law form:
 (2)
(2)
Here, α1 and α2 are the inner and outer slope indices at the break radius, rbreak, and djump = ne, in/ne, out represents the density jump between the inner (ne, in) and outer (ne, out) regions. The best fit indicates a density jump of djump = 1.7 ± 0.7 at  . In the eastern direction, a surface brightness discontinuity is also evident at
  (∼154 kpc), which may represent an X-ray tail stripped from the cluster core. On larger scales, we detected an excess of X-ray emission between ∼1′−2′ to the south. This southern excess is spatially aligned with the filamentary distribution of red galaxies, potentially suggesting ongoing accretion along a south–north intracluster filament (see the optical image in Fig. 7 and the discussion in Sect. 5).
3.2. Dynamical state
The asymmetric morphology shown in the exposure-corrected Chandra image, along with the edges and excess indicated from the surface brightness profiles, suggests that the cluster SPT-CL J0217−5014 is dynamically disturbed. To further assess and quantify its dynamical state, we measured three widely used morphological parameters and a recently proposed parameter introduced by Yuan & Han (2020).
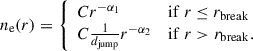
Relaxed galaxy clusters typically host more luminous cool cores than disturbed galaxy clusters (e.g. Fabian et al. 1984; McDonald et al. 2012). Based on this, the concentration index c, defined as the ratio of surface brightness within a core radius of 100 kpc to that within a large radius of 500 kpc, can be used as an indicator of the dynamical state of a galaxy cluster. Following the method adopted in Santos et al. (2008) and Cassano et al. (2010), the concentration index c is calculated as
 (3)
(3)
This parameter is widely used to identify cool-core clusters, particularly at high redshifts, where spatially resolved spectroscopic analysis of the cluster core is often not feasible.
In merging galaxy clusters, the X-ray surface brightness peak often deviates significantly from the model-fitted centroid, in contrast to relaxed clusters, where the offset is typically small. Poole et al. (2006) quantified this offset using the centroid shift (ω), defined as the standard deviation of the projected separation between the X-ray peak and the centroid within a series of concentric apertures ranging from 0.05 Rap to Rap:
![Mathematical equation: $$ \begin{aligned} \omega = \left[\frac{1}{n-1}\sum _{i}(\Delta _{i} - \langle \Delta \rangle )^{2}\right]^{1/2} \times \frac{1}{R_{\rm ap}}, \end{aligned} $$](/articles/aa/full_html/2026/01/aa56907-25/aa56907-25-eq21.gif) (4)
(4)
where n is the number of apertures, Δi is the distance between the X-ray peak and centroid in the i-th aperture, ⟨Δ⟩ is the mean of all Δi, and Rap is the maximum aperture radius. In our analysis, we adopted Rap = 500 kpc and n = 20.
The power ratio P3/P0 is derived from a multipole decomposition of the surface brightness map within a circular aperture and is particularly sensitive to asymmetric fluctuations and sub-clumps, which are more prominent in disturbed clusters (Buote & Tsai 1995). We refer to Buote & Tsai (1995) for the complete definition and formulation.
Given the fact that the above three traditional methods are prone to being affected by the distance (or redshift) of the galaxy clusters, Yuan & Han (2020) introduced a new parameter, the morphology index δ, as a redshift-independent indicator of cluster dynamic state. This index consists of two adaptive quantities derived from the Chandra image: the profile parameter κ = (1 + ϵ)/β, based on the ellipticity (ϵ) and power-law index (β) of a fitted two-dimensional elliptical β-model, and the asymmetry factor α, which quantifies the deviations from point symmetry about the cluster centre:
![Mathematical equation: $$ \begin{aligned} \alpha = \frac{\sum \limits _{x_i, y_i}\left[f_{\rm obs}(x_i, y_i)-f_{\rm obs}(x_i^{\prime }, y_i^{\prime })\right]^2}{\sum \limits _{x_i, y_i}f_{\rm obs}^2(x_i, y_i)} \times 100\,\mathrm{per\,cent}, \end{aligned} $$](/articles/aa/full_html/2026/01/aa56907-25/aa56907-25-eq22.gif) (5)
(5)
where fobs(xi, yi) is the observed flux at pixel (xi, yi), and fobs(xi′,yi′) is the flux at its point-symmetric counterpart with respect to the cluster centre (x0, y0). To construct the morphology index, Yuan & Han (2020) fitted a linear equation of the form δ = Aκ + Bα + C to a sample of 125 galaxy clusters with known dynamical states. The best-fit empirical relation is
 (6)
(6)
Clusters with δ > 0 are considered dynamically disturbed. This index correlates well with other morphological parameters while offering improved robustness against redshift (Yuan & Han 2020; Yuan et al. 2022).
By applying the four methods, we obtained the following measurements for SPT-CL J0217−5014: the concentration index log10(c) = − 0.70 ± 0.06, centroid shift log10(ω) = − 1.97 ± 0.32, power ratio log10(P3/P0) = − 5.88 ± 0.26, and morphology index δ = 0.86 ± 0.01. The X-ray surface brightness map of SPT-CL J0217−5014 and the derived morphological parameters are shown in Fig. 3. The classification criteria for the dynamical state of galaxy clusters are typically based on empirical thresholds derived from large samples. Following the empirical thresholds from Cassano et al. (2010) and Yuan & Han (2020), clusters with log10(c) > − 0.7, log10(ω) < − 1.92, log10(P3/P0) < − 6.92, and δ < 0 are generally considered relaxed or cool-core clusters. In Fig. 4, the locus of SPT-CL J0217−5014 is marked in different morphological parameter spaces. We find that the power ratio (P3/P0) and morphology index (δ) clearly place SPT-CL J0217−5014 in the dynamically disturbed regime, likely because these parameters are more sensitive to substructures. In contrast, the concentration index (c) and centroid shift (ω) lie close to the dividing thresholds and thus do not provide a definitive classification regarding the presence of a cool core. Numerical simulations suggest that cool cores can, in some cases, survive minor or off-axis mergers (Poole et al. 2008), so the possibility of a residual weak cool core cannot be excluded. Overall, the morphological indicators support a scenario in which SPT-CL J0217−5014 has undergone recent dynamical activity.
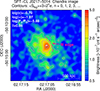 |
Fig. 3. Brightness map of SPT-CL J0217−5014 with contours. The best-fit parameters of the dynamical state are shown in the top-left corner. The W edge is also indicated. |
 |
Fig. 4. Distribution of 1844 galaxy clusters in three morphological parameter spaces (from left to right): ω − c, P3/P0 − ω, and κ − α. Data are from Yuan et al. (2022). We added the position of SPT-CL J0217−5014, and it is highlighted with a red cross. |
4. X-ray spectral analysis
4.1. Global spectral properties
As indicated by the azimuthally averaged surface brightness profile (top-left panel of Fig. 2), the cluster surface brightness approaches the background level at around  (∼0.7 R500). We therefore extracted spectra from a circular region with a radius of
  , centred on the X-ray centroid in each of the three observations separately, and analysed them by jointly fitting the spectra. The background-subtracted spectra were fitted with an absorbed thermal model (phabs*apec), with the hydrogen column density NH fixed at 1.63 × 1020 cm−2 (HI4PI Collaboration 2016). The gas temperature, metal abundance, and normalisation were left as free parameters. A grouping of one count per bin was applied, and the C-statistic (Kaastra 2017) was used for spectral fitting due to the limited photon statistics.
The best-fit parameters obtained using the four different background files are consistent with each other. We show only the results derived with the blank-sky background in Table 1 and the best-fit spectrum in Fig. 5. The corresponding results when using the three other background files are provided in Appendix A. The gas temperature was found to lie in the range 5 − 7 keV. To reduce fitting uncertainties, the redshift was fixed at 0.53 during spectral analysis. We also tested leaving the redshift as a free parameter, yielding values in the range z ∼ 0.51 − 0.55, which is consistent with earlier redshift measurements (Tozzi et al. 2014; Bleem et al. 2015; Bocquet et al. 2019; Zou et al. 2022). Although the derived metal abundance ( ) is subject to large uncertainties, it remains lower than the supersolar value and is consistent with the typical redshift-abundance trend derived from central (0 − 0.1 R500) or intermediate (0.1 − 0.5 R500) regions (Ettori et al. 2015; Mantz et al. 2017; Liu et al. 2020).
Spectral fitting results from different regions using the blank-sky background.
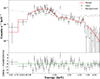 |
Fig. 5. Best-fit X-ray spectra extracted within a |

We noticed that the gas temperature and abundance values derived within  (∼0.7 R500) in this work are lower than those reported by Tozzi et al. (2014), who used Swift data and obtained a gas temperature of
  keV and a metal abundance of
  Z⊙ within
  (∼0.8 R500). To investigate this difference, we re-fitted the Chandra spectrum using the blank-sky background, adopting the same abundance table (Aspl; Asplund et al. 2009) and models (tbabs*mekal) used in their analysis. We found that the gas temperature remained unchanged, whereas the abundance changed slightly to
  Z⊙. This discrepancy could be attributed to the potential cross-calibration issues between Chandra and Swift XRT (e.g. Tsujimoto et al. 2011; Moretti et al. 2012) and the possibility of residual point-source contamination in Swift XRT data given its ∼15″ resolution. Moreover, the higher non-X-ray background of Chandra (compared to Swift XRT; see Moretti et al. 2007, 2012) may result in large residual uncertainties after background subtraction, reducing the significance of the Fe K lines relative to the continuum spectrum and affecting the measurements of both the bremsstrahlung component and the iron abundance. Although the 1σ intervals of the measurements from Chandra and Swift do not overlap, they may still be marginally consistent at the 90% confidence level.
4.2. Radial spectral analysis and cool core identification
To investigate the radial temperature structure and assess the presence of a cool core, we extracted spectra from three concentric annuli (see also Fig. 1b): an inner region ( , ∼80 kpc), an intermediate region (
 ), and an outer region (
 ). Because of limited photon statistics, the abundances are either less constrained or have large uncertainties. We therefore fixed the abundance to the global value, Z = 0.61 Z⊙, derived from the spectra within
  , and refit all three regions. The resulting temperatures changed by less than 7%, which is smaller than their statistical uncertainties, indicating that our temperature measurements are robust against the assumed abundance.
 |
Fig. 6. Best-fit temperature, electron number density, entropy, and cooling time profiles with 1σ confidence intervals derived from the MCMC analysis described in Sect. 4.2. |
Following the approach of Ruppin et al. (2021), a joint fit of X-ray and SZ data can better constrain the density profile in low-S/N systems, which allow only one or two radial bins for temperature analysis. We computed the X-ray surface brightness SX(R) by integrating the gas emissivity along the line of sight:
 (7)
(7)
where np(r) (≈ne(r)/1.2) is the proton density for a fully ionised plasma with one solar abundance, and the cooling function Λ(T, Z) was implemented via a lookup table generated with XSPEC over a temperature grid of T = 0.5 − 20 keV, assuming a constant abundance of 0.61 Z⊙ so that Λ(T, Z) can be rapidly evaluated at each temperature. The integrated Compton-y parameter from SZ measurements probes the electron pressure (Pe = ne Te):
 (8)
(8)
Here, σT is the Thomson scattering cross-section, me is the mass of the electron, and c is the speed of light. The term θmax is the maximum angular distance from the cluster centre considered to integrate the SZ signal. We adopted  arcmin2 from the catalogue in Bleem et al. (2015). Since we have three temperature bins, we included an additional constraint by fitting the temperature profile using the temperature model from Vikhlinin et al. (2006):
![Mathematical equation: $$ \begin{aligned} T(x) = 1.35\,T_{\rm ICM}\,\frac{(x/0.045)^{1.9} + \alpha }{(x/0.045)^{1.9} + 1}\,\frac{1}{\left[1 + (x/0.6)^{2}\right]^{\alpha }}, \end{aligned} $$](/articles/aa/full_html/2026/01/aa56907-25/aa56907-25-eq50.gif) (9)
(9)
where x = r/R500, TICM is the mean ICM temperature, and α is the core-to-mean temperature ratio. The electron density profile ne(r) was modelled with a single-β function:
![Mathematical equation: $$ \begin{aligned} n_{\rm e}(r) = n_{0} \left[1 + \left(\frac{r}{r_{\rm c}}\right)^2\right]^{-3\beta /2}. \end{aligned} $$](/articles/aa/full_html/2026/01/aa56907-25/aa56907-25-eq51.gif) (10)
(10)
Here, rc and β are the core radius and slope parameter. As described in Ruppin et al. (2021), we performed a Markov chain Monte Carlo (MCMC) analysis using the emcee Python package (Foreman-Mackey et al. 2013) with 96 walkers and 15000 steps per walker in order to efficiently sample the parameter space of n0, rc, β, TICM, α, and Sbkg. We adopted broad, physically motivated uniform priors on all model parameters within the ranges listed in Table 2. Gaussian likelihoods were used to compare the models with the observed X-ray surface-brightness profile, temperature profile, and SZ YSZ value. The best-fit parameters are listed in Table 2, and the resulting temperature and electron density profiles with 1σ confidence intervals are shown in Fig. 6.
Priors and best-fit parameters for the joint X-ray–SZ MCMC analysis.
Since the X-ray surface brightness approaches the background level at  , the outer slope of the density profile is poorly constrained. Attempts to fit more complex models, such as a double-β or broken-β profile, did not improve the fit, as either the second component was degenerate with the first or the outer parameters were unconstrained. Therefore, we adopted the single-β model, but we note that it may not capture the true outer density slope.
To further assess the cool-core status, we derived the entropy profile, K (= ), and the cooling time (Sarazin 1988):
 (11)
(11)
We present them in Fig. 6. The central entropy and cooling time exceed the weak cool-core thresholds (K0 < 150 keV cm2 and tcool < 7.7 Gyr; Hudson et al. 2010; Zhang et al. 2016), placing this system in the non–cool-core category. The elevated central entropy, long cooling time, and disturbed X-ray morphology together suggest that SPT-CL J0217−5014 has likely experienced merger activity, which could have disrupted any pre-existing cool core and prevented the re-establishment of a stable cooling flow.
5. DESI optical counterparts
Galaxy clusters form and evolve along the nodes and filaments of the cosmic web, frequently undergoing mergers driven by large-scale structure dynamics. Given the dynamical disturbance indicated by our X-ray analysis (see Sect. 3.2), we examined the optical (and infrared) data for galaxies in the environment of this system to search for potential large-scale structures associated with the cluster. Several recent large and deep optical surveys, such as the DESI Legacy Imaging Surveys (DR8, DR9, DR10; Dey et al. 2019), DES DR2 (Abbott et al. 2021), and HSC-SSP PDR3 (Aihara et al. 2022), have led to the construction of extensive galaxy cluster catalogues (e.g. Zou et al. 2021, 2022; Kluge et al. 2024; Wen & Han 2024; Yantovski-Barth et al. 2024). Although the spectroscopic survey of DESI has not yet covered the region of our target cluster, photometric data are available.
We searched across the publicly available optical cluster catalogues and found that Zou et al. (2022) identified an optical counterpart of our target cluster, along with three nearby clusters at similar photometric redshifts. Using the photometric redshifts of galaxies estimated from DESI DR9 and WISE data, Zou et al. (2022) applied the clustering by fast search and find of density peaks (CFSFDP) method and identified 532 810 galaxy clusters at z < 1 with a photo-z uncertainty of about 0.017. In Fig. 7 we present the DESI Legacy Survey composite image1 of SPT-CL J0217−5014 using g-, r-, and z-bands from DESI DR9. Within its R500 radius, we found a prominent elongated distribution of red galaxies in the image (highlighted by an orange arrow). This filamentary galaxy distribution is consistent with the X-ray surface brightness excess identified to the south (see Sect. 3.1 and Fig. 2).
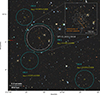 |
Fig. 7. Composite DESI Legacy survey image of SPT-CL J0217−5014 using g-, r-, and z-bands data. The white dashed circle shows the R500 region of SPT-CL J0217−5014. Four galaxy clusters identified by Zou et al. (2022) using DESI DR9 data are marked by cyan dashed circles centred on the BCGs with a radius of R500. The BCGs are marked by yellow circles. The photometric redshifts at their BCGs are marked as well. In the inserted zoom-in view of SPT-CL J0217−5014, the X-ray contours shown in Fig. 3 are overlaid, and the distribution of member galaxies is indicated. |
We noticed a small X-ray clump about  (∼580 kpc) south of the cluster centre that is spatially coincident with a blue galaxy. According to the photo-z provided by the DESI Legacy Surveys DR9, this blue galaxy is more likely a foreground galaxy at z = 0.224 ± 0.025. To assess its impact, we split the S sector into two equal sectors (see Fig. 1b) and extracted the corresponding surface brightness profiles shown in the bottom-right panel of Fig. 2. This foreground galaxy is located approximately
  from the cluster centre in the S–E sector, and its residual X-ray emission after point-source subtraction contributes part of the excess in this region. Furthermore, using the S-sector surface brightness profile and the best-fit β-model, we roughly estimate that the excess emission in the 1′−2′ radial range corresponds to a luminosity of ∼3.3 × 1042 erg s−1 in the 0.5 − 2 keV band. This luminosity would be compatible with that of a low-mass galaxy group potentially associated with the blue galaxy; however, a search in the DESI and DES optical catalogues around z ≃ 0.224 reveals no galaxy concentration at this position, disfavouring the presence of a foreground galaxy group. Therefore, the foreground galaxy likely accounts for a fraction of the excess in the S–E sector but not for the entire southern excess. In contrast, the excess in the S–W sector between ∼1′ and 2′ remains clearly visible and is aligned with the filamentary distribution of red galaxies. This might indicate that the S–W excess is contributed by gas stripped from galaxies falling into SPT-CL J0217–5014 along an intracluster filament connected to the surrounding large-scale cosmic filament, along which external matter is being accreted onto the cluster (Maturi & Merten 2013; HyeongHan et al. 2024).
Four clusters of galaxies (ClGs) identified by Zou et al. (2022) are marked in Fig. 7, and the photometric redshifts of their BCGs are labelled. ClG 1 coincides with our target cluster SPT-CL J0217−5014 and has a richness of 305, while ClG 2–4 have richness values of 61, 49, and 77, respectively. The lower richness of the neighbouring systems indicates that SPT-CL J0217−5014 is the primary, most massive cluster in this complex, and it likely sits at a node of the surrounding large-scale structure. Its disturbed X-ray morphology and the non-cool-core thermodynamic properties point to a dynamical history that has been strongly influenced by mergers. A plausible scenario is that an energetic, possibly close-to-head-on merger in the past disrupted a pre-existing cool core and/or prevented the establishment of a long-lived cool core (e.g. ZuHone 2011; Valdarnini & Sarazin 2021). In this picture, the western edge would correspond to a merger-driven cold front associated with the remnant low-entropy core of the infalling subcluster, which is now largely embedded within the global X-ray emission of SPT-CL J0217−5014 and therefore not easily identifiable as a separate X-ray peak.
The neighbouring systems, clusters ClG 2 and ClG 3, are located close to SPT-CL J0217−5014 in projection and have similar photometric redshifts. If they are physically associated with the system, they could also represent lower-mass companions that have undergone mergers or infall onto the main cluster a few gigayears ago. Such interactions can stir the ICM and excite long-lived sloshing, thus helping shape the observed cold front and tail-like features (e.g. Hu et al. 2021). At a larger projected distance, another cluster (ClG 4; z ≈ 0.57) lies along the same direction in which the filamentary galaxy distribution within SPT-CL J0217−5014 extends. Although a direct interaction with SPT-CL J0217−5014 is unlikely, its alignment supports the presence of a broader cosmic structure connecting these systems. Overall, a combination of past mergers with lower-mass companions and ongoing anisotropic accretion along cosmic filaments provides a natural framework to understand the disturbed ICM and non–cool-core state of SPT-CL J0217−5014.
Although these three nearby clusters lie outside the field of view of Chandra, the two nearer clusters are within the coverage of Swift observations. However, no significant X-ray counterparts with detectable thermal emission are found in the Swift data. We also cross-matched with the eROSITA galaxy cluster catalogue (Bulbul et al. 2024), but we found no detections of these systems, likely due to their lower X-ray luminosities. Future X-ray observations with higher sensitivity and lower background will be essential to confirm the physical association and thermodynamic properties of these optically identified systems. The upcoming 4-meter Multi-Object Spectroscopic Telescope (4MOST; de Jong et al. 2019) will conduct a large-field-of-view spectroscopic survey of the southern sky, enabling an independent test of the putative optical filaments linking SPT-CL J0217−5014, as suggested by the DESI Legacy Survey imaging. Moreover, the spectroscopic data will reveal the details of the merging process of SPT-CL J0217−5014, providing line-of-sight velocities of member galaxies, mass ratios of subclusters, and an estimate of the merger timescale.
6. Summary
In this work, we have presented a detailed analysis of the galaxy cluster SPT-CL J0217−5014 using ∼100 ks of Chandra observations. Our main results are summarised as follows:
-
The Chandra image reveals that SPT-CL J0217−5014 has a disturbed morphology characterised by a surface brightness edge at
 (∼100 kpc) to the west and a tail-like feature extending to the east, suggesting a disturbed, non-relaxed ICM.
 -
The dynamical state of the cluster was assessed using four morphological parameters. The concentration index (c) and centroid shift (ω) are close to the canonical thresholds separating cool-core and non–cool-core systems and thus do not provide a definitive classification. In contrast, the power ratio (P3/P0) and morphology index (δ) clearly place SPT-CL J0217−5014 in the dynamically disturbed regime, indicating the system has experienced merger activity.
-
A joint X-ray and SZ analysis of the surface brightness profile, temperature profile, and the SPT integrated Compton parameter yielded the density, entropy, and cooling time profiles. These results classify SPT-CL J0217−5014 as a non–cool-core cluster.
-
The best-fit metal abundance within
 (∼0.7 R500) is
  Z⊙. This sub-solar abundance is consistent with the typical metallicities observed in non–cool-core clusters, where dynamical processes could disrupt the cool core and tend to mix the central metal-rich gas with the outer ICM.
 -
Optical data revealed an elongated distribution of red galaxies within the cluster’s R500 radius. This filamentary galaxy distribution aligns closely with an X-ray surface brightness excess towards the southern region, possibly due to gas stripped from galaxies infalling along an intracluster filament.
-
Three potential galaxy clusters, ClG 2–4, near SPT-CL J0217−5014 were identified by Zou et al. (2022) using DESI DR9. Their lower richness confirms that SPT-CL J0217−5014 is the primary, most massive cluster in this complex and that it likely sits at a node of the surrounding large-scale structure.
-
SPT-CL J0217–5014 likely underwent an energetic, nearly head-on merger that disrupted a pre-existing cool core. ClG 2 and ClG 3 may be lower-mass companions that have merged with or infallen onto the main cluster, while ClG 4 aligns with the extension of the filamentary galaxy distribution, suggesting its association with a broader cosmic web. Taken together, past mergers and ongoing filamentary accretion provide a natural explanation for the disturbed ICM and the present non–cool-core state.
Overall, SPT-CL J0217−5014 emerges as a valuable laboratory for studying how mergers and anisotropic accretion shape the thermodynamic and chemical properties of the ICM in massive clusters at intermediate redshift. Future deep X-ray, radio, weak-lensing, and optical spectroscopic observations will be essential to clarify its assembly history further and to place this system in the broader context of cluster evolution at the nodes of the cosmic web.
Acknowledgments
DH and NW acknowledge the financial support of the GAČR EXPRO grant No. 21-13491X. ZSY is supported by the science research grant from the China Manned Space Project (Grant No. CMS-CSST-2025-A04) and the National SKA Program of China (Grant No. 2022SKA0120103). SDF, YYZ, and HGX acknowledge the support of the National Natural Science Foundation of China (NFSC) Grant No. 12233005.
References
- Abbott, T. M. C., Adamów, M., Aguena, M., et al. 2021, ApJS, 255, 20 [NASA ADS] [CrossRef] [Google Scholar]
- Aihara, H., AlSayyad, Y., Ando, M., et al. 2022, PASJ, 74, 247 [NASA ADS] [CrossRef] [Google Scholar]
- Arnaud, K. A. 1996, ASP Conf. Ser., 101, 17 [Google Scholar]
- Asplund, M., Grevesse, N., Sauval, A. J., & Scott, P. 2009, ARA&A, 47, 481 [NASA ADS] [CrossRef] [Google Scholar]
- Biffi, V., Mernier, F., & Medvedev, P. 2018, Space Sci. Rev., 214, 123 [NASA ADS] [CrossRef] [Google Scholar]
- Bleem, L. E., Stalder, B., de Haan, T., et al. 2015, ApJS, 216, 27 [Google Scholar]
- Bocquet, S., Dietrich, J. P., Schrabback, T., et al. 2019, ApJ, 878, 55 [Google Scholar]
- Böhringer, H., & Werner, N. 2010, A&ARv, 18, 127 [Google Scholar]
- Böhringer, H., Matsushita, K., Churazov, E., Finoguenov, A., & Ikebe, Y. 2004, A&A, 416, L21 [NASA ADS] [CrossRef] [EDP Sciences] [Google Scholar]
- Bulbul, E., Liu, A., Kluge, M., et al. 2024, A&A, 685, A106 [NASA ADS] [CrossRef] [EDP Sciences] [Google Scholar]
- Buote, D. A., & Tsai, J. C. 1995, ApJ, 452, 522 [Google Scholar]
- Cassano, R., Ettori, S., Giacintucci, S., et al. 2010, ApJ, 721, L82 [Google Scholar]
- Chiang, Y.-K., Overzier, R., & Gebhardt, K. 2013, ApJ, 779, 127 [Google Scholar]
- Daddi, E., Dannerbauer, H., Stern, D., et al. 2009, ApJ, 694, 1517 [Google Scholar]
- De Grandi, S., & Molendi, S. 2001, ApJ, 551, 153 [NASA ADS] [CrossRef] [Google Scholar]
- De Grandi, S., Santos, J. S., Nonino, M., et al. 2014, A&A, 567, A102 [NASA ADS] [CrossRef] [EDP Sciences] [Google Scholar]
- de Jong, R. S., Agertz, O., Berbel, A. A., et al. 2019, The Messenger, 175, 3 [NASA ADS] [Google Scholar]
- Dey, A., Schlegel, D. J., Lang, D., et al. 2019, AJ, 157, 168 [Google Scholar]
- Duchesne, S. W., Grundy, J. A., Heald, G. H., et al. 2024, PASA, 41, e003 [NASA ADS] [CrossRef] [Google Scholar]
- Eckert, D., Finoguenov, A., Ghirardini, V., et al. 2020, Open J. Astrophys., 3, 12 [NASA ADS] [CrossRef] [Google Scholar]
- Esposito, M., Borgani, S., Strazzullo, V., et al. 2025, A&A, 697, A142 [NASA ADS] [CrossRef] [EDP Sciences] [Google Scholar]
- Ettori, S., Baldi, A., Balestra, I., et al. 2015, A&A, 578, A46 [NASA ADS] [CrossRef] [EDP Sciences] [Google Scholar]
- Fabian, A. C., Nulsen, P. E. J., & Canizares, C. R. 1984, Nature, 310, 733 [NASA ADS] [CrossRef] [Google Scholar]
- Foreman-Mackey, D., Hogg, D. W., Lang, D., & Goodman, J. 2013, PASP, 125, 306 [Google Scholar]
- Foster, A. R., Ji, L., Smith, R. K., & Brickhouse, N. S. 2012, ApJ, 756, 128 [Google Scholar]
- Fruscione, A., McDowell, J. C., Allen, G. E., et al. 2006, SPIE Conf. Ser., 6270, 62701V [Google Scholar]
- Fujita, Y., Tawa, N., Hayashida, K., et al. 2008, PASJ, 60, S343 [Google Scholar]
- Ghizzardi, S., De Grandi, S., & Molendi, S. 2014, A&A, 570, A117 [NASA ADS] [CrossRef] [EDP Sciences] [Google Scholar]
- HI4PI Collaboration (Ben Bekhti, N., et al.) 2016, A&A, 594, A116 [NASA ADS] [CrossRef] [EDP Sciences] [Google Scholar]
- Hu, D., Xu, H., Kang, X., et al. 2019, ApJ, 870, 61 [NASA ADS] [CrossRef] [Google Scholar]
- Hu, D., Xu, H., Zhu, Z., et al. 2021, ApJ, 913, 8 [NASA ADS] [CrossRef] [Google Scholar]
- Hudson, D. S., Mittal, R., Reiprich, T. H., et al. 2010, A&A, 513, A37 [NASA ADS] [CrossRef] [EDP Sciences] [Google Scholar]
- HyeongHan, K., Jee, M. J., Cha, S., & Cho, H. 2024, Nat. Astron., 8, 377 [NASA ADS] [CrossRef] [Google Scholar]
- Kaastra, J. S. 2017, A&A, 605, A51 [NASA ADS] [CrossRef] [EDP Sciences] [Google Scholar]
- Kluge, M., Comparat, J., Liu, A., et al. 2024, A&A, 688, A210 [NASA ADS] [CrossRef] [EDP Sciences] [Google Scholar]
- Kravtsov, A. V., & Borgani, S. 2012, ARA&A, 50, 353 [Google Scholar]
- Kuntz, K. D., & Snowden, S. L. 2000, ApJ, 543, 195 [Google Scholar]
- Liu, A., Tozzi, P., Ettori, S., et al. 2020, A&A, 637, A58 [NASA ADS] [CrossRef] [EDP Sciences] [Google Scholar]
- Lovisari, L., & Reiprich, T. H. 2019, MNRAS, 483, 540 [Google Scholar]
- Mantz, A. B., Allen, S. W., Morris, R. G., et al. 2017, MNRAS, 472, 2877 [NASA ADS] [CrossRef] [Google Scholar]
- Mao, J., de Plaa, J., Kaastra, J. S., et al. 2019, A&A, 621, A9 [NASA ADS] [CrossRef] [EDP Sciences] [Google Scholar]
- Maturi, M., & Merten, J. 2013, A&A, 559, A112 [NASA ADS] [CrossRef] [EDP Sciences] [Google Scholar]
- McDonald, M., Bayliss, M., Benson, B. A., et al. 2012, Nature, 488, 349 [Google Scholar]
- McDonald, M., Bulbul, E., de Haan, T., et al. 2016, ApJ, 826, 124 [Google Scholar]
- Mernier, F., Biffi, V., Yamaguchi, H., et al. 2018, Space Sci. Rev., 214, 129 [Google Scholar]
- Miller, T. B., Chapman, S. C., Aravena, M., et al. 2018, Nature, 556, 469 [CrossRef] [Google Scholar]
- Moretti, A., Perri, M., Capalbi, M., et al. 2007, SPIE Conf. Ser., 6688, 66880G [Google Scholar]
- Moretti, A., Vattakunnel, S., Tozzi, P., et al. 2012, A&A, 548, A87 [NASA ADS] [CrossRef] [EDP Sciences] [Google Scholar]
- Mushotzky, R. F., Cowie, L. L., Barger, A. J., & Arnaud, K. A. 2000, Nature, 404, 459 [NASA ADS] [CrossRef] [Google Scholar]
- Nomoto, K., Kobayashi, C., & Tominaga, N. 2013, ARA&A, 51, 457 [CrossRef] [Google Scholar]
- Poole, G. B., Fardal, M. A., Babul, A., et al. 2006, MNRAS, 373, 881 [Google Scholar]
- Poole, G. B., Babul, A., McCarthy, I. G., Sanderson, A. J. R., & Fardal, M. A. 2008, MNRAS, 391, 1163 [CrossRef] [Google Scholar]
- Roediger, E., Brüggen, M., Simionescu, A., et al. 2011, MNRAS, 413, 2057 [Google Scholar]
- Ruppin, F., McDonald, M., Bleem, L. E., et al. 2021, ApJ, 918, 43 [NASA ADS] [CrossRef] [Google Scholar]
- Santos, J. S., Rosati, P., Tozzi, P., et al. 2008, A&A, 483, 35 [NASA ADS] [CrossRef] [EDP Sciences] [Google Scholar]
- Santos, J. S., Tozzi, P., Rosati, P., Nonino, M., & Giovannini, G. 2012, A&A, 539, A105 [NASA ADS] [CrossRef] [EDP Sciences] [Google Scholar]
- Sarazin, C. L. 1986, Rev. Mod. Phys., 58, 1 [Google Scholar]
- Sarazin, C. L. 1988, Sky Telesc., 76, 639 [NASA ADS] [Google Scholar]
- Simionescu, A., Werner, N., Urban, O., et al. 2015, ApJ, 811, L25 [NASA ADS] [CrossRef] [Google Scholar]
- Smith, R. K., Brickhouse, N. S., Liedahl, D. A., & Raymond, J. C. 2001, ApJ, 556, L91 [Google Scholar]
- Tozzi, P., Moretti, A., Tundo, E., et al. 2014, A&A, 567, A89 [NASA ADS] [CrossRef] [EDP Sciences] [Google Scholar]
- Tsujimoto, M., Guainazzi, M., Plucinsky, P. P., et al. 2011, A&A, 525, A25 [NASA ADS] [CrossRef] [EDP Sciences] [Google Scholar]
- Urban, O., Werner, N., Allen, S. W., Simionescu, A., & Mantz, A. 2017, MNRAS, 470, 4583 [Google Scholar]
- Valdarnini, R., & Sarazin, C. L. 2021, MNRAS, 504, 5409 [NASA ADS] [CrossRef] [Google Scholar]
- Vikhlinin, A., Kravtsov, A., Forman, W., et al. 2006, ApJ, 640, 691 [Google Scholar]
- Vogelsberger, M., Marinacci, F., Torrey, P., et al. 2018, MNRAS, 474, 2073 [NASA ADS] [CrossRef] [Google Scholar]
- Wen, Z. L., & Han, J. L. 2024, ApJS, 272, 39 [NASA ADS] [CrossRef] [Google Scholar]
- Werner, N., Böhringer, H., Kaastra, J. S., et al. 2006, A&A, 459, 353 [NASA ADS] [CrossRef] [EDP Sciences] [Google Scholar]
- Werner, N., Durret, F., Ohashi, T., Schindler, S., & Wiersma, R. P. C. 2008, Space Sci. Rev., 134, 337 [CrossRef] [Google Scholar]
- Werner, N., Urban, O., Simionescu, A., & Allen, S. W. 2013, Nature, 502, 656 [Google Scholar]
- Wilms, J., Allen, A., & McCray, R. 2000, ApJ, 542, 914 [Google Scholar]
- Yantovski-Barth, M. J., Newman, J. A., Dey, B., et al. 2024, MNRAS, 531, 2285 [NASA ADS] [CrossRef] [Google Scholar]
- Yuan, Z. S., & Han, J. L. 2020, MNRAS, 497, 5485 [Google Scholar]
- Yuan, Z. S., Han, J. L., & Wen, Z. L. 2022, MNRAS, 513, 3013 [NASA ADS] [CrossRef] [Google Scholar]
- Zhang, C., Xu, H., Zhu, Z., et al. 2016, ApJ, 823, 116 [NASA ADS] [CrossRef] [Google Scholar]
- Zou, H., Gao, J., Xu, X., et al. 2021, ApJS, 253, 56 [NASA ADS] [CrossRef] [Google Scholar]
- Zou, H., Sui, J., Xue, S., et al. 2022, RAA, 22, 065001 [NASA ADS] [Google Scholar]
- ZuHone, J. A. 2011, ApJ, 728, 54 [Google Scholar]
Appendix A: Spectral fitting using different background files
We present the best-fit results using the other three background files, i.e. stowed background and two sets of local backgrounds, in Table A.1, and exhibit their spectra in Fig. A.1. For the spectral fitting using the stowed background, we additionally accounted for the X-ray sky background by adopting the model phabs*(apec+powerlaw+apec). The first apec component models the soft X-ray emission from the Galactic halo, with its temperature and abundance fixed at 0.2 keV and 1 Z⊙ (Kuntz & Snowden 2000), respectively. The powerlaw component represents unresolved cosmic X-ray point sources (e.g. AGNs), with a fixed photon index of Γ = 1.4 (Mushotzky et al. 2000).
Spectral fitting results within  using different background files.
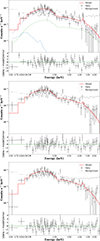 |
Fig. A.1. Same as Fig. 5 but using the other three background files: stowed background (top), local background from the annular region (middle), and box regions (bottom). |
All Tables
All Figures
|
Fig. 1. Exposure-corrected 0.5−7 keV Chandra ACIS-I0–3 image of SPT-CL J0217−5014. (a) Full Chandra ACIS-I field-of-view image of the cluster. The source extraction region, centred on the X-ray centroid, is shown by a white circle with a radius of |
| In the text | |
|
Fig. 2. Radial surface brightness profiles extracted from a set of azimuthally averaged (full 360°) regions and from sector regions in four different directions, as indicated in the legend of each panel. The best-fit single-β model for the azimuthally averaged surface brightness profile and the best-fit background parameter are also presented in all panels. The best-fit projected broken power-law model for the western surface brightness profile is presented in the top-right panel. |
| In the text | |
|
Fig. 3. Brightness map of SPT-CL J0217−5014 with contours. The best-fit parameters of the dynamical state are shown in the top-left corner. The W edge is also indicated. |
| In the text | |
|
Fig. 4. Distribution of 1844 galaxy clusters in three morphological parameter spaces (from left to right): ω − c, P3/P0 − ω, and κ − α. Data are from Yuan et al. (2022). We added the position of SPT-CL J0217−5014, and it is highlighted with a red cross. |
| In the text | |
|
Fig. 5. Best-fit X-ray spectra extracted within a |
| In the text | |
|
Fig. 6. Best-fit temperature, electron number density, entropy, and cooling time profiles with 1σ confidence intervals derived from the MCMC analysis described in Sect. 4.2. |
| In the text | |
|
Fig. 7. Composite DESI Legacy survey image of SPT-CL J0217−5014 using g-, r-, and z-bands data. The white dashed circle shows the R500 region of SPT-CL J0217−5014. Four galaxy clusters identified by Zou et al. (2022) using DESI DR9 data are marked by cyan dashed circles centred on the BCGs with a radius of R500. The BCGs are marked by yellow circles. The photometric redshifts at their BCGs are marked as well. In the inserted zoom-in view of SPT-CL J0217−5014, the X-ray contours shown in Fig. 3 are overlaid, and the distribution of member galaxies is indicated. |
| In the text | |
|
Fig. A.1. Same as Fig. 5 but using the other three background files: stowed background (top), local background from the annular region (middle), and box regions (bottom). |
| In the text | |
Current usage metrics show cumulative count of Article Views (full-text article views including HTML views, PDF and ePub downloads, according to the available data) and Abstracts Views on Vision4Press platform.
Data correspond to usage on the plateform after 2015. The current usage metrics is available 48-96 hours after online publication and is updated daily on week days.
Initial download of the metrics may take a while.