| Issue |
A&A
Volume 705, January 2026
|
|
|---|---|---|
| Article Number | A136 | |
| Number of page(s) | 9 | |
| Section | Stellar structure and evolution | |
| DOI | https://doi.org/10.1051/0004-6361/202556922 | |
| Published online | 14 January 2026 | |
The hard ultraluminous state of NGC 5055 ULX X-1
1
Facultad de Ciencias Astronómicas y Geofísicas, Universidad Nacional de La Plata B1900FWA La Plata, Argentina
2
Instituto de Astrofísica de Canarias (IAC), Vía Láctea, La Laguna E-38205 Santa Cruz de Tenerife, Spain
3
Departamento de Astrofísica, Universidad de La Laguna E-38206 Santa Cruz de Tenerife, Spain
4
Instituto Argentino de Radioastronomía (CCT La Plata, CONICET; CICPBA; UNLP), C.C.5, (1894) Villa Elisa, Argentina
★ Corresponding author: This email address is being protected from spambots. You need JavaScript enabled to view it.
Received:
20
August
2025
Accepted:
29
October
2025
Abstract
We present the results of the first broadband X-ray analysis of the ultraluminous X-ray source NGC 5055 ULX X-1, combining simultaneous data from XMM–Newton and NuSTAR missions, with a combined exposure time of ∼100 ks across the 0.3–20 keV energy range. The source exhibits a stable flux across the entire exposure with no detectable pulsations by any instrument on their X-ray light curves, placing pulsed-fraction upper limits of 10% and 32% for XMM–Newton and NuSTAR, respectively. The X-ray spectrum is dominated by two thermal components consistent with the emission from an accretion disk, and shows a weak high-energy tail above 10 keV, with no statistical requirement for an additional nonthermal component. The unabsorbed 0.3 − 20 keV luminosity is ∼2 × 1040 erg s−1, evidencing the ULX nature of the source. The parameters obtained from spectral modeling are consistent with the hard ultraluminous state. Despite the fact that a neutron-star accretor cannot be ruled out by the available data, under the assumption that the compact object in NGC 5055 ULX X-1 is a black hole accreting through a geometrically thick, radiation-pressure-supported disk that drives an optically thick wind, we constrained its putative mass to 11 − 26 M⊙.
Key words: accretion / accretion disks / stars: black holes / stars: neutron / X-rays: binaries
© The Authors 2026
 Open Access article, published by EDP Sciences, under the terms of the Creative Commons Attribution License (https://creativecommons.org/licenses/by/4.0), which permits unrestricted use, distribution, and reproduction in any medium, provided the original work is properly cited.
This article is published in open access under the Subscribe to Open model. This email address is being protected from spambots. You need JavaScript enabled to view it. to support open access publication.
1. Introduction
Ultraluminous X-ray sources (ULXs) are extragalactic X-ray sources distinguished by their isotropic luminosities exceeding 1039 erg s−1, surpassing the Eddington limit for stellar-mass black holes (BHs; Fabbiano 1989; Makishima et al. 2000; Feng & Soria 2011). These sources provide a unique laboratory for studying accretion processes under extreme conditions, whether through supercritical accretion onto stellar-mass compact objects or sub-Eddington accretion onto intermediate-mass black holes (IMBHs) (Colbert & Mushotzky 1999; Makishima et al. 2000; Miller et al. 2003; Strohmayer & Mushotzky 2009; Fabrika et al. 2021). Although early interpretations invoked IMBHs to explain ULX luminosities, the detection of X-ray pulsations has confirmed that many ULXs harbor neutron stars (NSs). Additional systems are consistent with super-Eddington accretion onto stellar-mass BHs, favoring stellar-mass compact objects over IMBHs (Fabrika & Mescheryakov 2001; King et al. 2001; Mushtukov et al. 2017; Fabrika et al. 2021).
Simultaneous observations with X-ray telescopes such as XMM–Newton and NuSTAR have enabled a more precise characterization of the spectral and temporal properties of ULXs. These studies have revealed a diversity of spectral states, commonly classified – in the soft X-ray band only (0.3–10 keV), as originally defined by Sutton et al. (2013) – into three categories: the soft ultraluminous (SUL) state, the hard ultraluminous (HUL) state, and the broadened disk (BD) state (Sutton et al. 2013; Pintore et al. 2020; Walton et al. 2020). In the SUL state, the spectrum is dominated by a cool thermal component (kT < 0.5 keV) and a soft power-law index (Γ > 2), while the HUL state is characterized by a hard power-law index (Γ < 2) regardless of the thermal component. By contrast, the BD state features a hotter thermal component (kT > 0.5 keV) dominating the spectrum, with a flux ratio between the power-law and disk components (FPL/Fdisk) < 5 in the 0.3–1 keV range (Sutton et al. 2013; Walton et al. 2020). These classifications reflect the complex interactions between the accretion disk, the corona, and the outflows generated under supercritical accretion conditions.
A key aspect in the study of ULXs is the presence of NS, both pulsating and non-pulsating. The detection of coherent pulsations in several ULXs, such as M82 X-2 (Bachetti et al. 2014), has confirmed the presence of highly magnetized NSs in these systems, now classified as pulsating ULXs (PULXs). These systems challenge the theoretical limits of super-Eddington accretion, as NSs can achieve luminosities hundreds of times their Eddington limit without being disrupted (Mushtukov et al. 2017; Fabrika et al. 2021). Furthermore, it has been observed that the spectra of PULXs are virtually indistinguishable from those of other ULXs, suggesting that a significant fraction of ULXs may be powered by NSs, even in the absence of detectable pulsations (King et al. 2023).
The spectral properties of ULXs differ markedly from those of Galactic black hole binaries (BHXBs). While BHXBs typically exhibit spectral curvature at energies above 10 keV, ULXs show a soft excess and spectral curvature below 10 keV, indicating the presence of a modified accretion disk and an optically thick corona (Gladstone et al. 2009; Sutton et al. 2013). While this was the prevailing interpretation at the time, more recent models favor an inner super-Eddington accretion disk surrounded by an outer disk/photosphere and powerful, radiatively driven winds (e.g., Middleton et al. 2015; Pinto et al. 2017; Kosec et al. 2018a; Walton et al. 2018a). Within this framework, the X-ray spectra are naturally described by multiple thermal components (sampled from the inner disk and the wind-photosphere) together with a high-energy excess above ∼10 keV, which is the approach adopted in this work (e.g., Walton et al. 2018a). Models of disk inflation and optically thick winds predict the formation of outflows, whose presence has been confirmed through the detection of blueshifted emission lines in the spectra of several ULXs (Pinto et al. 2016; Abaroa et al. 2023). These outflows not only modulate the observed spectrum but also play a crucial role in regulating the accretion flow and the stability of the system.
NGC 5055 ULX X-1 is a ULX candidate located in the spiral galaxy M63, at a distance of 9.04 Mpc (Tully et al. 2013; McQuinn et al. 2017; Karachentsev et al. 2020). The source was first detected with ROSAT (Roberts & Warwick 2000) and has since been observed multiple times with Chandra, XMM–Newton, and Swift, consistently showing high X-ray luminosities up to 2.3 × 1040 erg s−1 (Swartz et al. 2011). A systematic analysis of these archival observations was conducted by Mondal et al. (2020), who modeled the spectra using combinations of a multicolor disk (MCD) with either a power law or a thermal Comptonization component, while also testing a slim disk model. Their results revealed a spectral transition between soft and hard states, minimal short-term variability, a possible inverse correlation between luminosity and inner disk temperature, and indications of super-Eddington accretion accompanied by mild geometric beaming. However, the limited exposure times (< 30 ks) and non-simultaneity of the observations limited the ability to constrain the spectral shape and its evolution.
Because of their high luminosities and complex spectral behavior, ULXs require broadband, temporally coordinated observations to constrain their emission mechanisms properly. Simultaneous data from XMM–Newton and NuSTAR provide complementary spectral coverage – XMM–Newton being sensitive to the soft X-ray regime and NuSTAR to the hard X-rays – allowing for robust modeling of both the thermal and high-energy components. This is particularly important to distinguish between BH and NS accretors, whose spectral signatures can otherwise appear degenerate in narrow energy bands.
Despite its persistent brightness, NGC 5055 ULX X-1 (hereafter NGC 5055) has received limited attention. Previous studies were based on isolated observations with either Chandra or XMM–Newton at different epochs, each having exposure times shorter than 30 ks (Mondal et al. 2020), limiting spectral coverage and temporal coherence. In this paper, we present the first simultaneous broadband analysis of NGC 5055 using XMM–Newton and NuSTAR, with a combined exposure exceeding 100 ks. This coordinated dataset enables a detailed investigation of both the continuum shape and potential variability, offering new insights into the nature of the accreting object.
This paper is structured as follows. In Sect. 2, we describe the observational data and the reduction procedures applied to both XMM–Newton and NuSTAR observations. In Sect. 3 we present the main results of our timing and spectral analyses, including the search for pulsations and the broadband spectral characterization of NGC 5055. In Sect. 4, we discuss the physical implications of these findings in the context of ULX accretion scenarios. Finally, in Sect. 5 we summarize our conclusions, highlighting their relevance to the broader understanding of ULXs.
2. Observations and data reduction
We analyzed simultaneous broadband X-ray data from the source NGC 5055, located at α = 13h15m19.69s and δ = 42° 03′02.1″, obtained with XMM–Newton (Newton Multi-Mirror X-ray Mission) and NuSTAR (Nuclear Spectroscopic Telescope Array; Harrison et al. 2013) observations. The calibration and data reduction processes for each observation are described in the following subsections.
2.1. XMM–Newton
The XMM–Newton observatory observed NGC 5055 on December 6, 2021 (ObsID 0885180101) with an exposure time of 133 ks. The European Photon Imaging Camera (EPIC), which includes the pn (Strüder et al. 2001) and MOS (Turner et al. 2001) detectors, operated in full-frame mode during the observation. Data reduction was performed using the XMM–Newton Science Analysis System (SAS) software, version 21.0.0. Calibrated event lists were generated using the epproc and emproc tasks for the pn and MOS cameras, respectively. Periods of high-energy background flaring activity were identified and excluded using thresholds of 0.25 and 0.3 counts per second in the 10–12 keV energy band for the MOS cameras (MOS1 and MOS2, respectively) and 0.4 counts per second for the pn camera (for details and results see Table 1). Source events were extracted from a circular region with a radius of 35 arcsec centered on NGC 5055, while background events were extracted from a nearby source-free region with a radius of 35 arcsec. Events were filtered using standard selection criteria: FLAG==0, PATTERN≤12 for MOS, and PATTERN≤4 for pn. Light curves were extracted and corrected for background and exposure using the SAS task epiclccorr, with barycentric corrections applied using the SAS task barycen. The response matrices and auxiliary files were then generated using the SAS tasks rmfgen and arfgen, respectively. The final spectra were grouped to ensure a minimum of 20 counts per bin to facilitate spectral analysis using χ2 statistics.
XMM–Newton and NuSTAR observations of NGC 5055 ULX X-1.
2.2. NuSTAR
NuSTAR observed NGC 5055 on December 05, 2021 (ObsID 30701003002), with an exposure time of ∼163 ks. NuSTAR’s two co-aligned focal-plane modules, FPMA and FPMB, provide coverage in the 3–79 keV energy range. Data were reduced using NuSTAR Data Analysis Software (NuSTARDAS) version 2.1.4, part of the HEASoft package (v.6.34), with calibration files from CALDB v.20241126. Calibrated event files were generated using the nupipeline task, applying the South Atlantic Anomaly (SAA) filter with the parameters saacalc=3, saamode=optimized and tentacle=no. This filtering resulted in a loss of ≲0.9% of the total exposure time (see Table 1). The source events were extracted from a circular region with a radius of 55 arcsec centered on the position of NGC 5055, enclosing ∼80% of the point spread function (PSF). Background events were selected from a source-free region twice the size of the source, located on the same detector chip for FPMA, and in the opposite detector chip for FPMB, to ensure minimal contamination from the source and detector edges. Light curves and spectra were extracted using the nuproducts task. Barycentric corrections were applied to the event files using the barycorr task, with the nuCclock20100101 clock correction file and the JPL-DE200 Solar System ephemeris. Background-corrected light curves were produced for both FPMA and FPMB modules and then combined using the lcmath task. The spectra were grouped to ensure a minimum of 20 counts per bin in the 3–78 keV energy range, allowing the use of χ2 statistics for spectral analysis.
3. Analysis and results
3.1. Timing analysis
We analyzed the background-subtracted light curves of NGC 5055 using combined data from the XMM–Newton and NuSTAR observations to search for any significant variability. The light curves were extracted in the 0.3–12 keV energy range for XMM–Newton and in the 3–78 keV range for NuSTAR. For each instrument, we visually inspected the light curves to search for high or low energy variability across several timescales. For XMM–Newton (pn camera), the light curve appears approximately constant, with an average count rate of ∼0.33 counts s−1 (see Fig 1). Similarly, the NuSTAR light curve shows no significant variability, with an average count rate of ∼0.045 counts s−1.
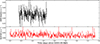 |
Fig. 1. Background-subtracted light curves of NGC 5055 X-1 extracted from the XMM–Newton and NuSTAR calibrated data in the 0.3–12 keV and 3–78 keV energy bands, respectively, both using a binning length of 800 s. |
We used the spectral timing algorithms provided by the HENDRICS (Bachetti 2018) and Stingray (Huppenkothen et al. 2019) software packages to investigate potential pulsations signals within the XMM–Newton and NuSTAR calibrated event files, using the same energy ranges as above. We performed this search in frequency ranges appropriate for each instrument, based on their sampling times and observation mode.
For the XMM–Newton EPIC-PN data, we searched for pulsations in the 0.01–6.81 Hz frequency range since the full-frame mode provides a Nyquist frequency of about 6.81 Hz. For NuSTAR, despite the shorter readout times of the FPMA/B detectors, which allow a theoretical Nyquist frequency of up to 200 Hz, we restricted our search to the 0.01–10.0 Hz range to avoid high-frequency noise and to be consistent with the XMM–Newton analysis.
We used the HENaccelsearch tool to search for pulsation candidates in the 0.01–6.81 Hz range, allowing for variable period derivatives up to 10−9 Hz s−1. No significant pulsation candidates were detected in any of the datasets. We then applied the HENz2vspf tool to determine an upper bound on the pulse fraction (PF). The PF is defined as the ratio between the amplitude of the pulsation and the maximum flux, potentially exhibited by each signal. This procedure scrambles the event times and adds a pulsation with a random pulsed fraction. It then extracts the maximum of the Z2 distribution within a small interval around the pulsation. This process is repeated Ntrial times. Based on 10000 simulations, we derived an upper limit for the PF (with 90% confidence). Specifically, we obtain a PF upper limit of 10%for the XMM–Newton data and 32% for the NuSTAR data.
3.2. Spectral analysis
The X-ray spectral analysis of NGC 5055 was performed using XSPEC v.12.13.1 (Arnaud 1996). The spectra from XMM–Newton (0.3–10 keV) and NuSTAR (3–20 keV) were grouped to ensure a minimum of 20 counts per bin, allowing for the use of χ2 statistics. The energy ranges were chosen to avoid background-dominated regions above 10 keV for XMM–Newton and 20 keV for NuSTAR. Unabsorbed fluxes and luminosities were derived using convolution models cflux and cglumin, assuming a distance of 9.04 Mpc (Tully et al. 2013; McQuinn et al. 2017; Karachentsev et al. 2020). To account for cross-calibration uncertainties, multiplicative constants were included in all spectral fits. The constant for EPIC-pn was fixed at 1, while those for MOS1, MOS2, and NuSTAR FPMA/FPMB were allowed to vary. The difference between MOS1 and MOS2 was ∼5%, and the difference between FPMA/FPMB was ∼10%, both relative to EPIC-pn (see e.g., Saavedra et al. 2023a). The broadband spectrum was modeled simultaneously in the 0.3–20 keV range and residuals were carefully examined to assess the quality of the fit.
Uncertainties were estimated using Markov chain Monte Carlo (MCMC) chains, generating 106 samples using the chain command in XSPEC. The number of walkers was set to 12 times the number of free parameters for each model (see Cruz-Sanchez et al. 2025, for more details). The convergence of the MCMC chains was verified by inspecting the trace plots of each parameter and ensuring that the chains had reached a stable state. This was confirmed by checking that the autocorrelation time was small (close to unity), indicating that the walkers had efficiently explored the parameter space (see Fogantini et al. 2023; Saavedra et al. 2023b for more details).
To classify the spectral state of NGC 5055, we followed the scheme proposed by Sutton et al. (2013), applying a model of the form tbnew1*tbnew*(diskbb+powerlaw) in the 0.3–10 keV energy range, adopting the photoionization cross sections of Verner et al. (1996) and the elemental abundances of Wilms et al. (2000). In this model, the diskbb component (Mitsuda et al. 1984) accounts for thermal emission from a multicolor accretion disk, while the powerlaw component represents a hard, nonthermal tail likely produced by Compton scattering or optically thin coronal emission. This model forms the basis of the decision-tree classification diagram introduced by Sutton et al. (2013), which relies exclusively on XMM–Newton data.
To remain consistent with the methodology of Sutton et al. (2013), we repeated the former procedure using only XMM–Newton data. In this case, the model provided a substantially improved fit, with a reduced χ2 of 1.07 for 345 d.o.f. The best-fit parameters were a disk temperature of kTin = 0.24 ± 0.01 keV and photon index of Γ = 1.66 ± 0.06, both consistent with sources classified in the HUL regime. Based on these results and the decision-tree criteria of Sutton et al. (2013), we classify NGC 5055 as being in the HUL state.
We modeled the 0.3–20 keV broadband X-ray spectrum of NGC 5055 with a two-layer neutral absorber along the line of sight, using the composite model tbnew*tbnew_pcf. An initial fit with the standard tbabs left a prominent residual around 0.95 keV. We therefore employed tbnew for its improved treatment of low-energy edges; however, the 0.95 keV feature persisted. Introducing an additional partial-covering neutral absorber, tbnew_pcf, removed this structure (see Fig. 2) and significantly improved the fit. In our final configuration, the tbnew component accounts for the Galactic column, fixed at NH = 3.72 × 1020 cm−2 following the H I survey of Kalberla et al. (2005), while tbnew_pcf represents intrinsic neutral absorption with partial covering – plausibly due to clumpy material or a fragmented disk wind near the compact object – with its column density and covering fraction left free.
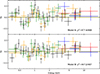 |
Fig. 2. Residuals from fitting two absorption configurations to the joint XMM–Newton and NuSTAR spectra (0.3–20 keV). Top panel: Model A = tbnew*(diskbb+diskpbb) (single neutral absorber; Galactic column only), which reveals a feature around ∼0.95 keV. Bottom panel: Model B = tbnew*tbnew_pcf*(diskbb+diskpbb) (additional partial-covering neutral absorber), in which this feature is unnoticeable. Data have been rebinned for visualization only. |
To explore the nature of the compact object in NGC 5055, we tested two physical scenarios commonly invoked in the ULX population. The first assumes a nonmagnetic stellar-mass BH accreting above the Eddington limit, while the second considers a strongly magnetized NS, as in the case of PULXs, despite the absence of detected pulsations in this source (see Section 3.1). In both cases, the joint XMM–Newton and NuSTAR spectra were used to model the continuum, incorporating the same two-component neutral absorption structure described earlier.
In the nonmagnetic scenario, we adopted a baseline, thermal model consisting of two multicolor accretion-disk components: a cooler outer disk represented by diskbb and a hotter inner disk described by diskpbb. To account for the Comptonization of the inner-disk photons, we convolved the hotter component with the simpl model (Steiner et al. 2009). The complete model was tbnew*tbnew_pcf*(diskbb+simpl*diskpbb), hereafter referred to as the simpl model. The diskpbb component (Mineshige et al. 1994) includes a free radial temperature index, p, where T(r) ∝ r−p. While p = 0.75 corresponds to a standard thin disk, lower values (p ≲ 0.7) are indicative of advection-dominated (slim) flows typical of super-Eddington accretion.
In the magnetized accretor scenario, we adopted the same thermal disk structure but replaced the Comptonization component with a high-energy tail modeled by a cutoff power law (cutoffpl). This component is commonly used to describe emission from magnetically collimated accretion columns (Walton et al. 2018a,b). The photon index and cutoff energy were fixed at Γ = 0.59 and Ecut = 7.1 keV (following: Brightman et al. 2016a; Walton et al. 2018b). The resulting configuration, tbnew*tbnew_pcf*(diskbb+ diskpbb+cutoffpl), is hereafter referred to as the cutoffpl model.
Both models yielded statistically acceptable fits to the spectrum over the 0.3–20 keV energy range, with similar χ2/d.o.f. and comparable residuals (see Table 2 and Fig. 3). The intrinsic absorption was NH ∼ 5 × 1021 cm−2 with covering fractions of fcov ∼ 0.8. In all cases the continuum is dominated by a cool outer disk at kT ∼ 0.19 keV plus a hotter inner flow at kT ∼ 1.8–2.1 keV, with p ∼ 0.6. The SIMPL model requires a steep Compton tail with Γs ∼ 3.3 and a scattering fraction of ∼70%, while the CUTOFFPL component contributes ≲11% of the total flux. Quantifying the preference for the additional high-energy terms using the likelihood-ratio test in XSPEC with 104 simulations, we found that adding SIMPL is favored at 2.4σ and adding CUTOFFPL at 2.2σ. Therefore, a purely thermal DISKBB+DISKPBB model provides an adequate description of the data without requiring a statistically significant high-energy excess (see Table 2). In all cases, the unabsorbed luminosity in the 0.3–20 keV band is ∼2 × 1040 erg s−1. For completeness, Appendix A presents the two-dimensional posterior projections of the MCMC results for the cutoffpl and simpl models (Figs. A.1a and A.1b). These results establish a robust spectral characterization of NGC 5055 ULX X–1 under both accretion scenarios, setting the foundation for further interpretation.
Best-fit parameters with 1σ level uncertainties derived from modeling the simultaneous XMM–Newton +NuSTAR dataset of NGC 5055.
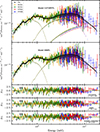 |
Fig. 3. XMM–Newton+ NuSTAR unfolded spectra of NGC 5055. The top panel shows the best-fit CUTOFFPL model. The second panel displays the SIMPL model fit. The bottom three panels show the residuals for each tested scenario with their corresponding χ2 values: CUTOFFPL (third panel), SIMPL (fourth panel), and DISKBB+DISKPBB (fifth panel). |
4. Discussion
4.1. Spectral state and inner-flow geometry
NGC 5055 radiates at an unabsorbed 0.3–20 keV luminosity of ∼2 × 1040 erg s−1, firmly in the ULX regime where super-Eddington accretion and/or mild beaming are required to explain the observed output. The measured fluxes, F0.3 − 1.5 keV = 1.0 × 10⁻¹² erg cm−2 s−1 and F1.5 − 10 keV = 5.5 × 10⁻¹³ erg cm−2 s−1, give a hardness ratio of H0.3 − 10 keV = 0.53, while the color–color ratios S = F2 − 4 keV/F4 − 6 keV = 1.57 and H = F6 − 30 keV/F4 − 6 keV = 1.7 locate the source on the left side of the hardness–luminosity diagram (HLD; Gúrpide et al. 2021) – between the 10× and 100× Eddington tracks for a 1.4 M⊙ NS – and in the central region of the color–color plane (CCD; Pintore et al. 2017) that hosts the majority of non-PULXs. These diagnostics place NGC 5055 well away from the hard, highly variable branch that typically contains PULXs, suggesting a geometry dominated by an inflated inner disk and a dense, optically thick wind rather than by an energetically dominant accretion column.
Over the 0.3–20 keV band, the broadband continuum is naturally captured by a nonmagnetic configuration in which a cool multicolour disk (diskbb) feeds a hotter, radially stratified inner flow (diskpbb). Mild Compton up-scattering in a warm, optically thick corona (SIMPL) can imprint the smooth curvature below ∼10 keV and any faint, steep nonthermal tail, while an additional cutoff power law (CUTOFFPL) may represent a weak hard excess if present. Crucially, these extra high-energy terms are not required by the data: a two-temperature thermal spectrum (diskbb+diskpbb), i.e., a combination of blackbody-like components, already provides an adequate description. This spectral morphology – a hard, disk-dominated continuum with a broadened inner flow and only a weak high-energy tail – is characteristic of the HUL regime, as seen in archetypal HUL ULXs such as NGC 1313 X-1 and Holmberg IX X-1 (Sutton et al. 2013; Luangtip et al. 2016; Pinto et al. 2020), and contrasts with confirmed ULX pulsars, whose pulsed high-energy continua are typically described by hard cutoff power laws rather than by a steep power-law excess (e.g., Brightman et al. 2016b; Walton et al. 2018b).
The presence of partial covering absorption with a high covering fraction (fcov ∼ 0.8) suggests a structured and optically thick absorber close to the accreting source. Such conditions are naturally expected in super-Eddington accretion regimes, where geometrically thick inflows and radiatively driven winds can obscure the inner emission (see e.g., Abaroa et al. 2023; Combi et al. 2024). Similar absorption features have been reported in ULXs such as NGC 1313 X-1 and Holmberg IX X-1, and are often interpreted as clumpy winds or warped structures in the inner accretion flow (Pinto et al. 2016, 2020; Kosec et al. 2018b, 2021). At the CCD-resolution of XMM–Newton, such clumpy winds frequently manifest as an apparent excess/feature near ∼1 keV, very similar to that seen here, consistent with the low-resolution spectra compiled by Middleton et al. (2015) for sources in which high-resolution studies reveal powerful winds. In our case, the inclusion of the tbnew_pcf component not only improves the spectral fit significantly, but also provides strong evidence of a complex and anisotropic environment around the compact object.
The timing analysis reveals no coherent pulsations, with a 10% pulsed-fraction upper limit. However, such non-detection does not allow us to discard the idea that the compact object has a neutron-star nature: some ULX pulsars show very low pulsed fractions (e.g., NGC 1313 X-2 at ∼5%; Sathyaprakash et al. 2019) and pulsations can be transient or intermittent (e.g., M82 X-2; Bachetti et al. 2020). The source’s position in the CCD and HLD diagrams, as well as the disk-like continuum, are all consistent with a black-hole accretor. Although a neutron-star accretor cannot be ruled out, we explore the black-hole scenario in detail to obtain an estimation of its putative mass.
4.2. Black-hole mass estimation
Adopting the best–fit configuration for a stellar-mass black-hole accretor, we describe the time-averaged 0.3–20 keV spectrum with the composite model tbabs*(diskbb + simpl*diskpbb). In this framework, the diskbb component represents the quasi-standard outer disk, while diskpbb captures the advection-dominated inner flow through a variable radial temperature index, p. The simpl convolution then models Compton up-scattering of seed photons in a tenuous, hot corona, producing the observed high-energy tail.
The physical scale of the accretion flow is derived from the diskpbb normalization (Kubota et al. 1998; Makishima et al. 1988):
 (1)
(1)
where rapp represents the apparent inner radius, D10 = D/(10 kpc) is the distance scaling, and θ denotes the inclination angle. For super-Eddington accretion regimes, the disk becomes geometrically thick, with the locally emitted spectrum hardened by electron scattering (Watarai & Mineshige 2003; Kawaguchi 2003; Shrader & Titarchuk 2003; Isobe et al. 2012). Following Vierdayanti et al. (2008), we applied corrections to the apparent inner radius:
 (2)
(2)
adopting a geometric correction factor, ξ = 0.353, and a color-hardening factor, κ = 3.0. The black-hole mass implied by the uncorrected slim disk formulation is
 (3)
(3)
where RISCO is the innermost stable circular orbit for a nonrotating BH. Since advection shifts the disk’s inner edge approximately 20% inside RISCO, we calculated the black-hole mass to be
 (4)
(4)
Using a distance to the source of 9.04 Mpc, a face-on accretion disk (θ = 0), and the best-fit normalization of the DISKPBB component,  , Equations (1)–(4) yield a nominal black-hole mass of MBH ≈ 16.0 M⊙. To assess the impact of systematic effects, we carried out a Monte-Carlo simulation with 2 × 10⁵ realizations using priors: the distance was modeled as a truncated Gaussian with a mean of 9.04 Mpc and standard deviation of 0.40 Mpc; the inclination was drawn from a uniform distribution in cos θ ∈ [0.3,1.0], as expected if high-inclination sight lines are preferentially obscured by thick winds/funnel structures (e.g., Sutton et al. 2013; Middleton et al. 2015; Pinto et al. 2016); the geometric factor adopted a truncated Gaussian centered at ξ = 0.353 with σ = 0.050, appropriate for slim disks (cf. thin-disk ξ ≃ 0.41 in Vierdayanti et al. 2008; Kubota et al. 1998); and the color–hardening factor was sampled uniformly from κ ∈ [2.0,3.5], spanning values expected at high accretion rates (e.g., Kawaguchi 2003; Isobe et al. 2012; Davis et al. 2005; Shimura & Takahara 1995). Under these assumptions we obtained
  (1σ). Our mass determinations are consistent with the hypothesis that the compact object is a stellar-mass BH accretor.
5. Conclusions
We have carried out the first analysis of a simultaneous XMM–Newton and NuSTAR observing campaign on the ULX NGC 5055, achieving ∼100 ks of effective exposure and continuous spectral coverage from 0.3 to 20 keV. No coherent pulsations are detected in the light curves of pn and FPM instruments, with 90% upper limits on the pulsed fraction of 10% (XMM–Newton) and 32% (NuSTAR). The time-averaged spectrum is dominated by a cool outer disk together with a hotter, advective inner flow, partially obscured by neutral material. The unabsorbed broadband luminosity, L0.3 − 20 keV ≃ 2 × 1040 erg s−1, places NGC 5055 firmly within the ultraluminous regime. Hardness-ratio and color–color diagnostics locate the source on the hard-ultraluminous branch, a region typically associated with super-Eddington accretion funneled through an inflated inner disk and an optically thick wind. After correcting the radial-temperature-profile normalization for color and geometric factors, we infer a black-hole mass of  . This mass estimate was derived under the assumption of a black-hole accretor; in the absence of definitive neutron-star signatures, a neutron-star accretor cannot be ruled out. High-resolution X-ray spectroscopy and long-baseline timing observations will be essential to detect wind signatures, constrain the viewing geometry, and search for any intermittent pulsations at lower flux levels.
Acknowledgments
We thank the anonymous reviewer for their valuable comments on this manuscript. Funded by the European Union (Project 101183150 – OCEANS). Views and opinions expressed are however those of the author(s) only and do not necessarily reflect those of the European Union or the European Research Executive Agency (REA). Neither the European Union nor REA can be held responsible for them. EAS acknowledges support by the Spanish Agencia estatal de investigación via PID2021-124879NB-I00. FAF is a postdoc fellow of CONICET. JAC and FG are CONICET researchers. FAF, JAC, and FG acknowledge support by PIP 0113 (CONICET). FG acknowledges support from PIBAA 1275 (CONICET). JAC was supported by Consejería de Economía, Innovación, Ciencia y Empleo of Junta de Andalucía as research group FQM-322. FG and JAC were also supported by grant PID2022-136828NB-C42 funded by the Spanish MCIN/AEI/ 10.13039/501100011033 and “ERDF A way of making Europe”.
References
- Abaroa, L., Romero, G. E., & Sotomayor, P. 2023, A&A, 671, A9 [NASA ADS] [CrossRef] [EDP Sciences] [Google Scholar]
- Arnaud, K. A. 1996, ASP Conf. Ser., 101, 17 [Google Scholar]
- Bachetti, M. 2018, Astrophysics Source Code Library [record ascl:1805.019] [Google Scholar]
- Bachetti, M., Harrison, F. A., Walton, D. J., et al. 2014, Nature, 514, 202 [NASA ADS] [CrossRef] [Google Scholar]
- Bachetti, M., Maccarone, T. J., Brightman, M., et al. 2020, ApJ, 891, 44 [Google Scholar]
- Brightman, M., Harrison, F., Walton, D. J., et al. 2016a, ApJ, 816, 60 [Google Scholar]
- Brightman, M., Harrison, F. A., Barret, D., et al. 2016b, ApJ, 829, 28 [CrossRef] [Google Scholar]
- Colbert, E. J. M., & Mushotzky, R. F. 1999, ApJ, 519, 89 [NASA ADS] [CrossRef] [Google Scholar]
- Combi, J. A., Fogantini, F. A., Saavedra, E. A., et al. 2024, A&A, 686, A121 [NASA ADS] [CrossRef] [EDP Sciences] [Google Scholar]
- Cruz-Sanchez, N., Fogantini, F. A., Saavedra, E. A., et al. 2025, A&A, 693, A122 [NASA ADS] [CrossRef] [EDP Sciences] [Google Scholar]
- Davis, S. W., Blaes, O. M., Hubeny, I., & Turner, N. J. 2005, ApJ, 621, 372 [CrossRef] [Google Scholar]
- Fabbiano, G. 1989, ARA&A, 27, 87 [NASA ADS] [CrossRef] [Google Scholar]
- Fabrika, S., & Mescheryakov, A. 2001, Symp. Int. Astron. Union, 205, 268 [Google Scholar]
- Fabrika, S. N., Atapin, K. E., Vinokurov, A. S., & Sholukhova, O. N. 2021, Astrophys. Bull., 76, 6 [NASA ADS] [CrossRef] [Google Scholar]
- Feng, H., & Soria, R. 2011, New Astron. Rev., 55, 166 [CrossRef] [Google Scholar]
- Fogantini, F. A., García, F., Combi, J. A., et al. 2023, A&A, 669, A149 [NASA ADS] [CrossRef] [EDP Sciences] [Google Scholar]
- Gladstone, J. C., Roberts, T. P., & Done, C. 2009, MNRAS, 397, 1836 [NASA ADS] [CrossRef] [Google Scholar]
- Gúrpide, A., Godet, O., Koliopanos, F., Webb, N., & Olive, J. F. 2021, A&A, 649, A104 [NASA ADS] [CrossRef] [EDP Sciences] [Google Scholar]
- Harrison, F. A., Craig, W. W., Christensen, F. E., et al. 2013, ApJ, 770, 103 [Google Scholar]
- Huppenkothen, D., Bachetti, M., Stevens, A. L., et al. 2019, ApJ, 881, 39 [Google Scholar]
- Isobe, N., Kubota, A., Sato, H., & Mizuno, T. 2012, PASJ, 64, 119 [NASA ADS] [Google Scholar]
- Kalberla, P. M. W., Burton, W. B., Hartmann, D., et al. 2005, A&A, 440, 775 [NASA ADS] [CrossRef] [EDP Sciences] [Google Scholar]
- Karachentsev, I. D., Neyer, F., Späni, R., & Zilch, T. 2020, Astron. Nachr., 341, 1037 [Google Scholar]
- Kawaguchi, T. 2003, ApJ, 593, 69 [Google Scholar]
- King, A. R., Davies, M. B., Ward, M. J., Fabbiano, G., & Elvis, M. 2001, ApJ, 552, L109 [NASA ADS] [CrossRef] [Google Scholar]
- King, A., Lasota, J.-P., & Middleton, M. 2023, New Astron. Rev., 96, 101672 [CrossRef] [Google Scholar]
- Kosec, P., Pinto, C., Walton, D. J., et al. 2018a, MNRAS, 479, 3978 [NASA ADS] [Google Scholar]
- Kosec, P., Pinto, C., Fabian, A. C., & Walton, D. J. 2018b, MNRAS, 473, 5680 [NASA ADS] [CrossRef] [Google Scholar]
- Kosec, P., Pinto, C., Reynolds, C. S., et al. 2021, MNRAS, 508, 3569 [NASA ADS] [CrossRef] [Google Scholar]
- Kubota, A., Tanaka, Y., Makishima, K., et al. 1998, PASJ, 50, 667 [NASA ADS] [CrossRef] [Google Scholar]
- Luangtip, W., Roberts, T. P., & Done, C. 2016, MNRAS, 460, 4417 [Google Scholar]
- Makishima, K., Ohashi, T., Sakao, T., et al. 1988, Nature, 333, 746 [NASA ADS] [CrossRef] [Google Scholar]
- Makishima, K., Kubota, A., Mizuno, T., et al. 2000, ApJ, 535, 632 [NASA ADS] [CrossRef] [Google Scholar]
- McQuinn, K. B. W., Skillman, E. D., Dolphin, A. E., Berg, D., & Kennicutt, R. 2017, AJ, 154, 51 [NASA ADS] [CrossRef] [Google Scholar]
- Middleton, M. J., Walton, D. J., Fabian, A., et al. 2015, MNRAS, 454, 3134 [Google Scholar]
- Miller, J. M., Fabbiano, G., Miller, M. C., & Fabian, A. C. 2003, ApJ, 585, L37 [NASA ADS] [CrossRef] [Google Scholar]
- Mineshige, S., Takeuchi, M., & Nishimori, H. 1994, ApJ, 435, L125 [NASA ADS] [CrossRef] [Google Scholar]
- Mitsuda, K., Inoue, H., Koyama, K., et al. 1984, PASJ, 36, 741 [NASA ADS] [Google Scholar]
- Mondal, S., Różańska, A., Lai, E. V., & De Marco, B. 2020, A&A, 642, A94 [NASA ADS] [CrossRef] [EDP Sciences] [Google Scholar]
- Mushtukov, A. A., Suleimanov, V. F., Tsygankov, S. S., & Ingram, A. 2017, MNRAS, 467, 1202 [NASA ADS] [Google Scholar]
- Pinto, C., Middleton, M. J., & Fabian, A. C. 2016, Nature, 533, 64 [Google Scholar]
- Pinto, C., Alston, W., Soria, R., et al. 2017, MNRAS, 468, 2865 [Google Scholar]
- Pinto, C., Walton, D. J., Kara, E., et al. 2020, MNRAS, 492, 4646 [Google Scholar]
- Pintore, F., Zampieri, L., Stella, L., et al. 2017, ApJ, 836, 113 [Google Scholar]
- Pintore, F., Marelli, M., Salvaterra, R., et al. 2020, ApJ, 890, 166 [NASA ADS] [CrossRef] [Google Scholar]
- Roberts, T. P., & Warwick, R. S. 2000, MNRAS, 315, 98 [NASA ADS] [CrossRef] [Google Scholar]
- Saavedra, E. A., Fogantini, F. A., Escobar, G. J., et al. 2023a, A&A, 680, A88 [NASA ADS] [CrossRef] [EDP Sciences] [Google Scholar]
- Saavedra, E. A., García, F., Fogantini, F. A., et al. 2023b, MNRAS, 522, 3367 [NASA ADS] [CrossRef] [Google Scholar]
- Sathyaprakash, R., Roberts, T. P., Walton, D. J., et al. 2019, MNRAS, 488, L35 [NASA ADS] [CrossRef] [Google Scholar]
- Shimura, T., & Takahara, F. 1995, ApJ, 445, 780 [Google Scholar]
- Shrader, C. R., & Titarchuk, L. 2003, ApJ, 598, 168 [NASA ADS] [CrossRef] [Google Scholar]
- Steiner, J. F., Narayan, R., McClintock, J. E., & Ebisawa, K. 2009, PASP, 121, 1279 [Google Scholar]
- Strohmayer, T. E., & Mushotzky, R. F. 2009, ApJ, 703, 1386 [NASA ADS] [CrossRef] [Google Scholar]
- Strüder, L., Briel, U., Dennerl, K., et al. 2001, A&A, 365, L18 [Google Scholar]
- Sutton, A. D., Roberts, T. P., & Middleton, M. J. 2013, MNRAS, 435, 1758 [NASA ADS] [CrossRef] [Google Scholar]
- Swartz, D. A., Soria, R., Tennant, A. F., & Yukita, M. 2011, ApJ, 741, 49 [NASA ADS] [CrossRef] [Google Scholar]
- Tully, R. B., Courtois, H. M., Dolphin, A. E., et al. 2013, AJ, 146, 86 [NASA ADS] [CrossRef] [Google Scholar]
- Turner, M. J. L., Abbey, A., Arnaud, M., et al. 2001, A&A, 365, L27 [CrossRef] [EDP Sciences] [Google Scholar]
- Verner, D. A., Ferland, G. J., Korista, K. T., & Yakovlev, D. G. 1996, ApJ, 465, 487 [Google Scholar]
- Vierdayanti, K., Watarai, K.-Y., & Mineshige, S. 2008, PASJ, 60, 653 [NASA ADS] [CrossRef] [Google Scholar]
- Walton, D. J., Fürst, F., Harrison, F. A., et al. 2018a, MNRAS, 473, 4360 [Google Scholar]
- Walton, D. J., Fürst, F., Heida, M., et al. 2018b, ApJ, 856, 128 [NASA ADS] [CrossRef] [Google Scholar]
- Walton, D. J., Pinto, C., Nowak, M., et al. 2020, MNRAS, 494, 6012 [Google Scholar]
- Watarai, K.-Y., & Mineshige, S. 2003, PASJ, 55, 959 [Google Scholar]
- Wilms, J., Allen, A., & McCray, R. 2000, ApJ, 542, 914 [Google Scholar]
Appendix A: Posterior distributions from the spectral models
We present here the posterior probability distributions obtained from the MCMC analysis of the three spectral models tested in this work: cutoffpl, simpl, and diskbb+diskpbb. Figures A.1a, A.1b, and A.1c show the corresponding corner plots, which display the one- and two-dimensional marginalized distributions of the main free parameters. Each plot is based on 106 converged MCMC iterations.
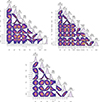 |
Fig. A.1. Corner plots showing the posterior probability distributions of the best-fit parameters obtained from the MCMC analysis of the three tested models: cutoffpl (top left), simpl (top right), and diskbb+diskpbb (bottom). NH and Tin are expressed in units of 1022 cm−2 and keV, respectively. Each distribution is based on 106 converged MCMC iterations. |
All Tables
Best-fit parameters with 1σ level uncertainties derived from modeling the simultaneous XMM–Newton +NuSTAR dataset of NGC 5055.
All Figures
|
Fig. 1. Background-subtracted light curves of NGC 5055 X-1 extracted from the XMM–Newton and NuSTAR calibrated data in the 0.3–12 keV and 3–78 keV energy bands, respectively, both using a binning length of 800 s. |
| In the text | |
|
Fig. 2. Residuals from fitting two absorption configurations to the joint XMM–Newton and NuSTAR spectra (0.3–20 keV). Top panel: Model A = tbnew*(diskbb+diskpbb) (single neutral absorber; Galactic column only), which reveals a feature around ∼0.95 keV. Bottom panel: Model B = tbnew*tbnew_pcf*(diskbb+diskpbb) (additional partial-covering neutral absorber), in which this feature is unnoticeable. Data have been rebinned for visualization only. |
| In the text | |
|
Fig. 3. XMM–Newton+ NuSTAR unfolded spectra of NGC 5055. The top panel shows the best-fit CUTOFFPL model. The second panel displays the SIMPL model fit. The bottom three panels show the residuals for each tested scenario with their corresponding χ2 values: CUTOFFPL (third panel), SIMPL (fourth panel), and DISKBB+DISKPBB (fifth panel). |
| In the text | |
|
Fig. A.1. Corner plots showing the posterior probability distributions of the best-fit parameters obtained from the MCMC analysis of the three tested models: cutoffpl (top left), simpl (top right), and diskbb+diskpbb (bottom). NH and Tin are expressed in units of 1022 cm−2 and keV, respectively. Each distribution is based on 106 converged MCMC iterations. |
| In the text | |
Current usage metrics show cumulative count of Article Views (full-text article views including HTML views, PDF and ePub downloads, according to the available data) and Abstracts Views on Vision4Press platform.
Data correspond to usage on the plateform after 2015. The current usage metrics is available 48-96 hours after online publication and is updated daily on week days.
Initial download of the metrics may take a while.