Fig. 1
Download original image
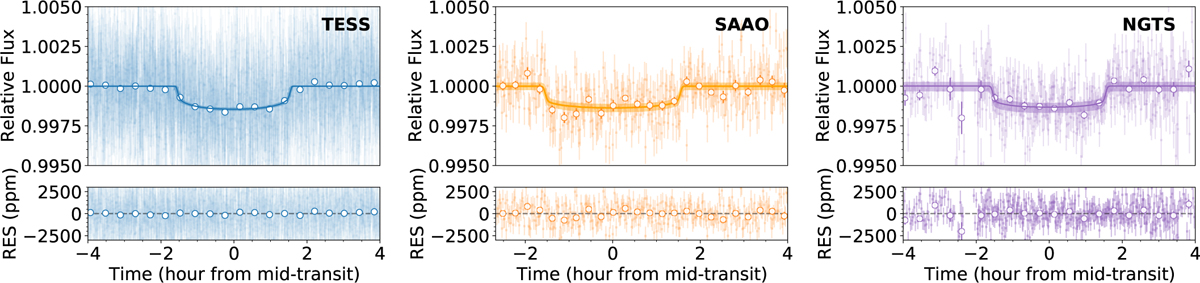
Left : TESS-detrended light curve phase-folded to the best-fitting period listed in Table 2 and zoomed to show the transit event. The blue and white circles correspond to modelled photometric data and binned data with the associated photon noise error. The blue line and shaded region show the median transit model and its 1σ confidence interval. Centre : same as the left panel for the LCOGT-SAAO telescope. Right : same as the left panel for the NGTS mission. Bottom : Residuals of the best-fit model.
Current usage metrics show cumulative count of Article Views (full-text article views including HTML views, PDF and ePub downloads, according to the available data) and Abstracts Views on Vision4Press platform.
Data correspond to usage on the plateform after 2015. The current usage metrics is available 48-96 hours after online publication and is updated daily on week days.
Initial download of the metrics may take a while.