Fig. 12
Download original image
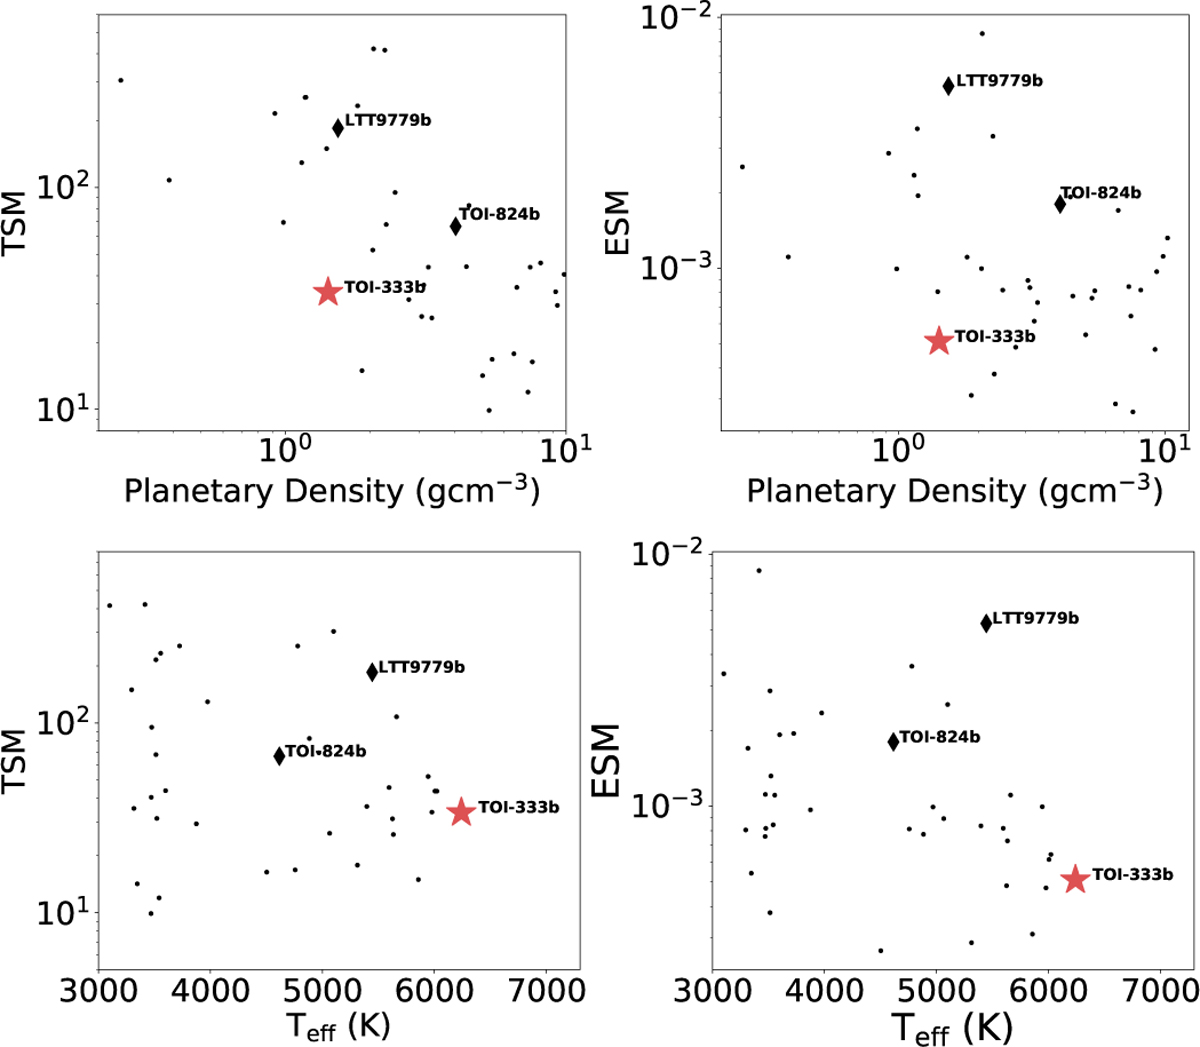
Top : transmission and emission spectroscopy metrics as a function of planetary density for the transiting ND sample, shown as black circles. The black diamonds highlight two benchmark ND planets for comparison with TOI-333b, which is marked by a red star. All TSM and ESM values were computed homogeneously using system parameters from the TEPCat catalogue. Bottom : TSM and ESM plotted against the effective host star temperature. The colour scheme and symbols follow those described in the top panel.
Current usage metrics show cumulative count of Article Views (full-text article views including HTML views, PDF and ePub downloads, according to the available data) and Abstracts Views on Vision4Press platform.
Data correspond to usage on the plateform after 2015. The current usage metrics is available 48-96 hours after online publication and is updated daily on week days.
Initial download of the metrics may take a while.