Fig. 3
Download original image
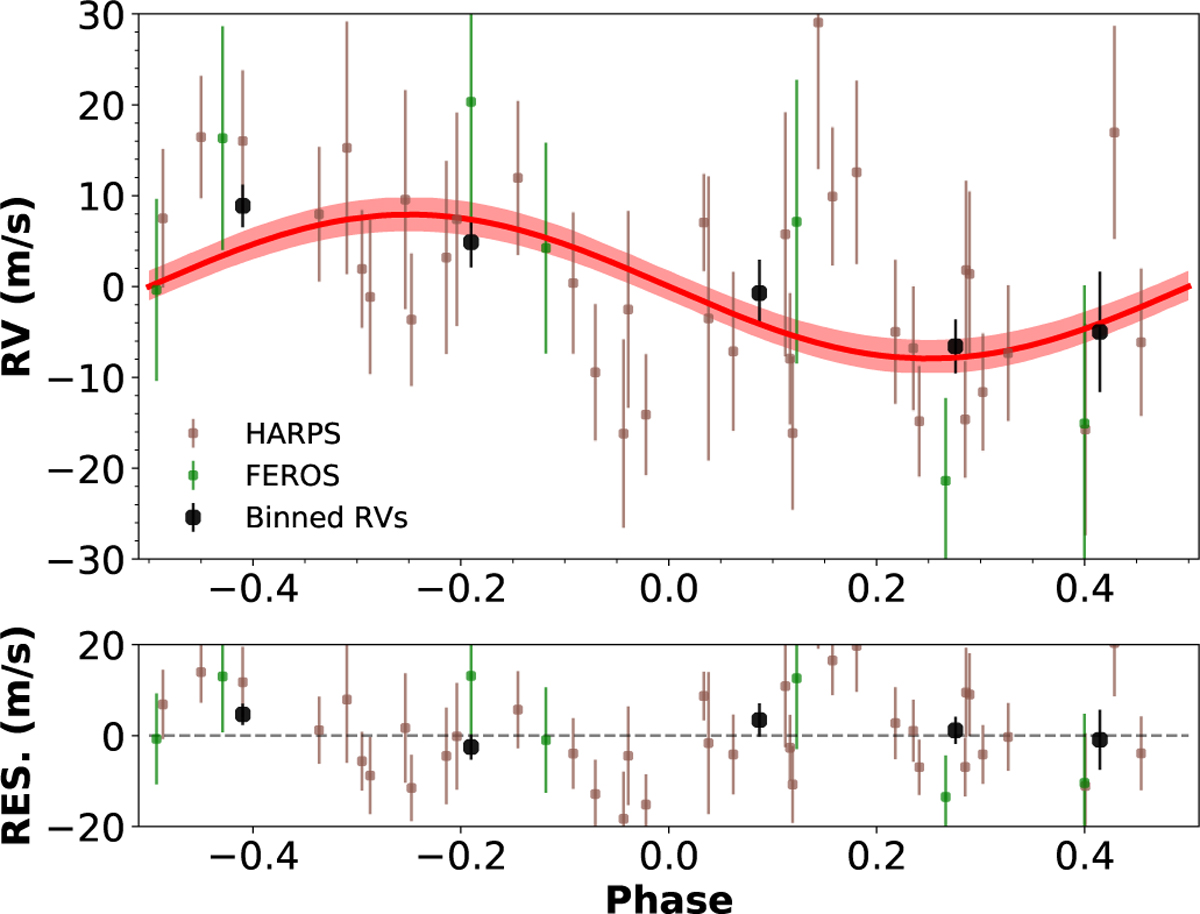
Top : radial velocity phase-folded to the best-fitting period listed in Table 2. The RV data are colour-coded in brown and green for HARPS and FEROS, respectively, and the black circles represent the binned RVs. The red curve and shaded light red region shows the Keplerian model and its 1σ confidence interval. Bottom : residuals of the best-fit model.
Current usage metrics show cumulative count of Article Views (full-text article views including HTML views, PDF and ePub downloads, according to the available data) and Abstracts Views on Vision4Press platform.
Data correspond to usage on the plateform after 2015. The current usage metrics is available 48-96 hours after online publication and is updated daily on week days.
Initial download of the metrics may take a while.