Fig. 5
Download original image
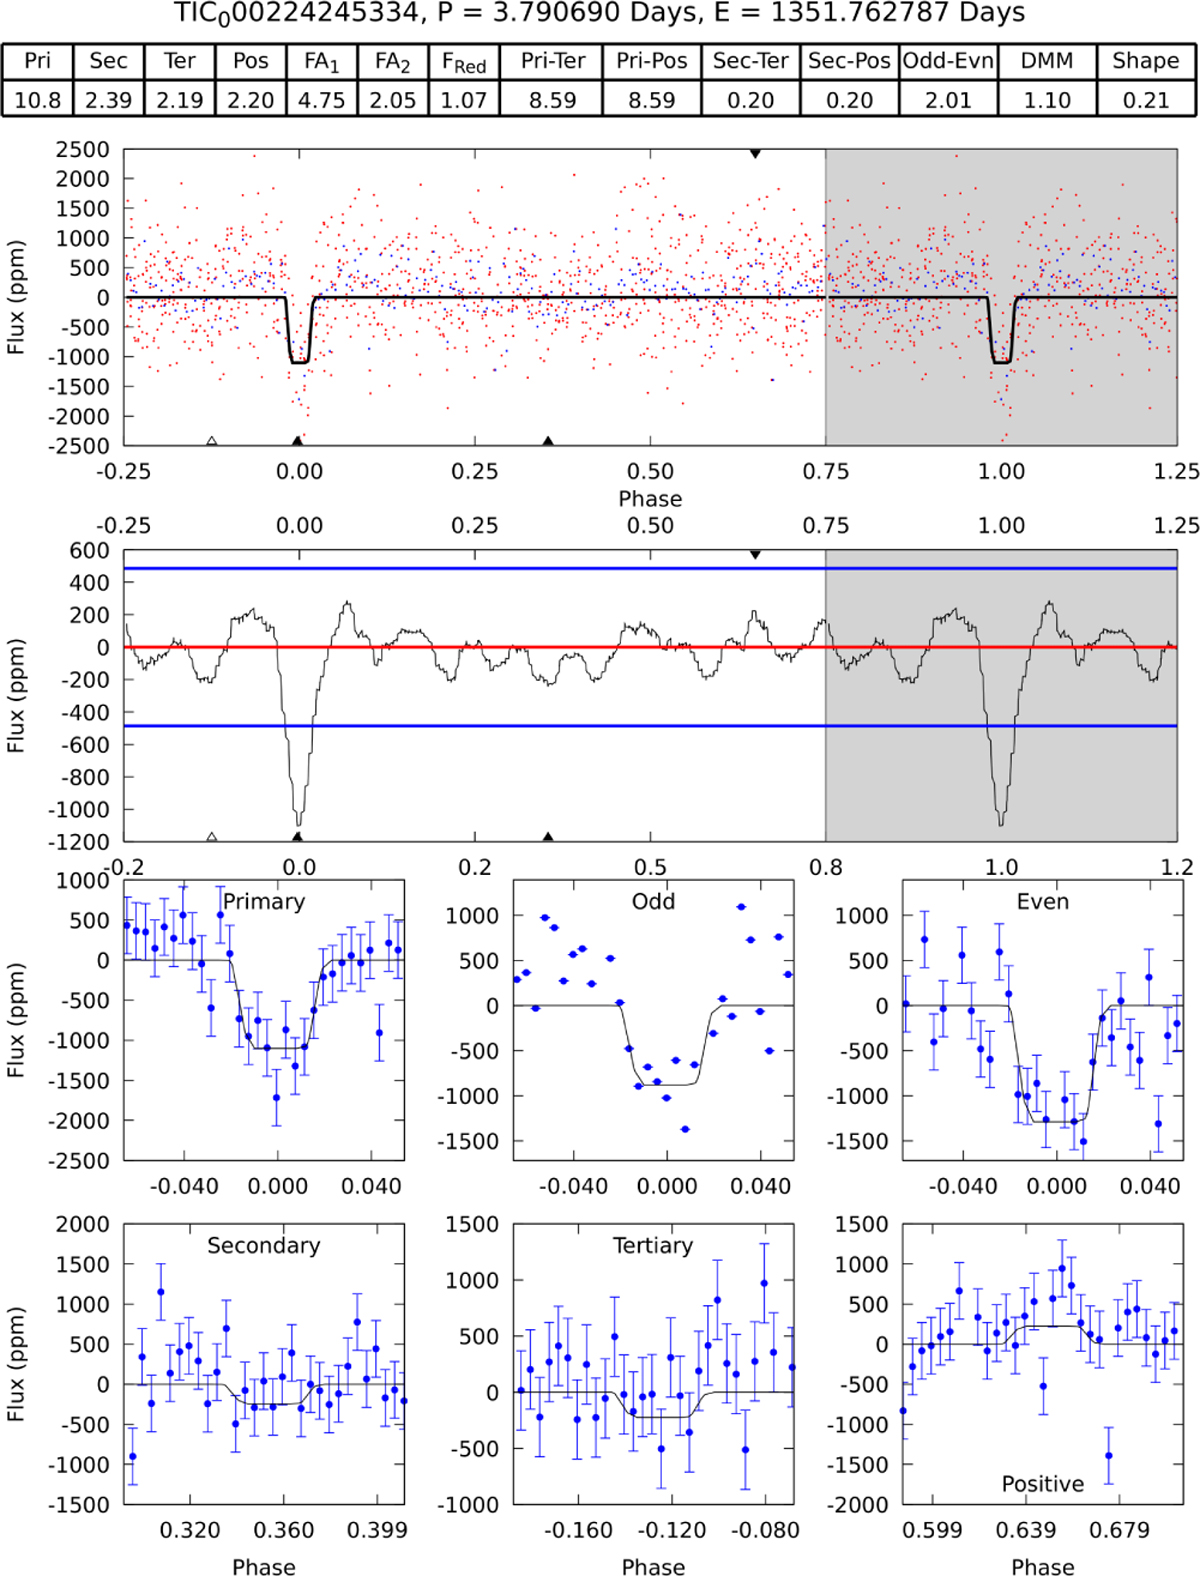
Modelshift module of TOI 333b obtained in TESS sector 02. The first panel displays the phase-folded light curve with the best-fit trapezoid transit model (black line). The second panel shows the convolved light curve with the transit model and noise level (blue lines). The lower panels offer close-ups of the primary and secondary events, both odd and even primaries, and any additional events. The upper panel indicates the statistical significance of these features and highlights them in red when they are flagged as significant by the pipeline.
Current usage metrics show cumulative count of Article Views (full-text article views including HTML views, PDF and ePub downloads, according to the available data) and Abstracts Views on Vision4Press platform.
Data correspond to usage on the plateform after 2015. The current usage metrics is available 48-96 hours after online publication and is updated daily on week days.
Initial download of the metrics may take a while.