Fig. 7
Download original image
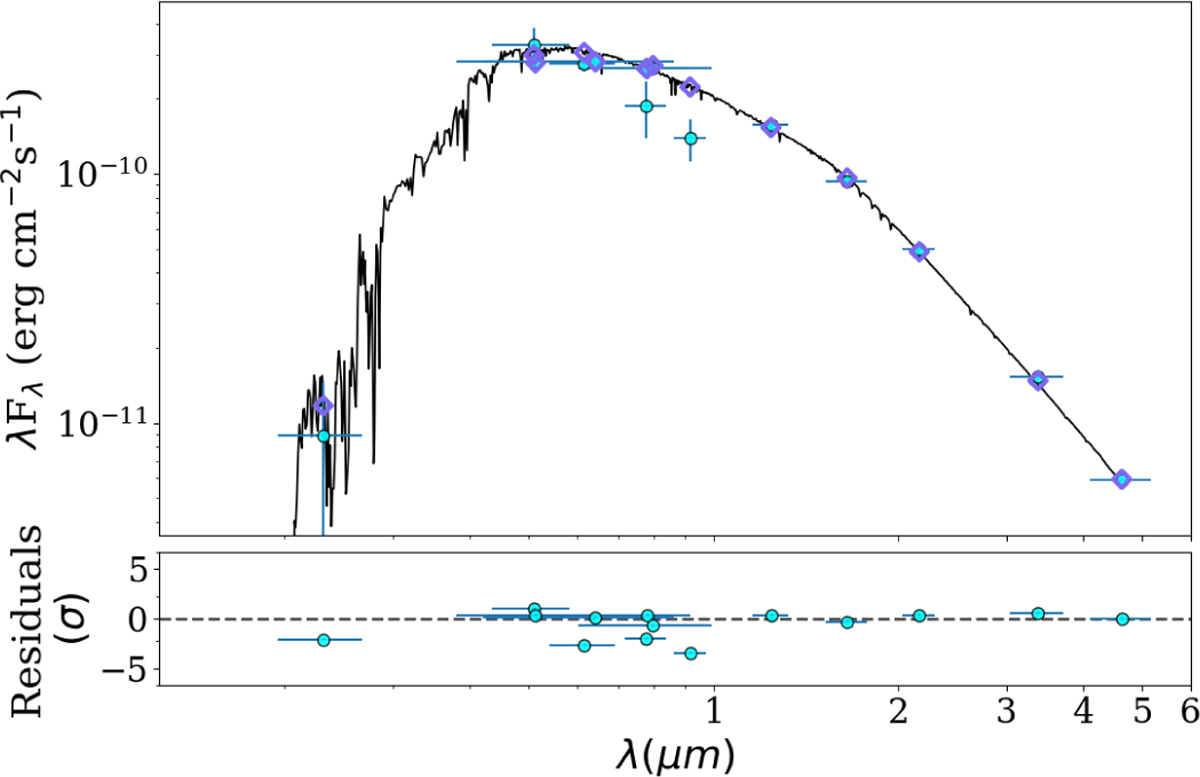
Top : best-fitting spectral energy distribution (black line) based on Castelli & Kurucz (2003) given the TOI-333 photometric data (cyan points) and their respective bandwidths shown as horizontal error bars. The purple diamonds represent the synthetic magnitudes centred at the wavelengths of the photometric data from Table 1. Bottom : residuals of the best fit in σ.
Current usage metrics show cumulative count of Article Views (full-text article views including HTML views, PDF and ePub downloads, according to the available data) and Abstracts Views on Vision4Press platform.
Data correspond to usage on the plateform after 2015. The current usage metrics is available 48-96 hours after online publication and is updated daily on week days.
Initial download of the metrics may take a while.