Fig. 8
Download original image
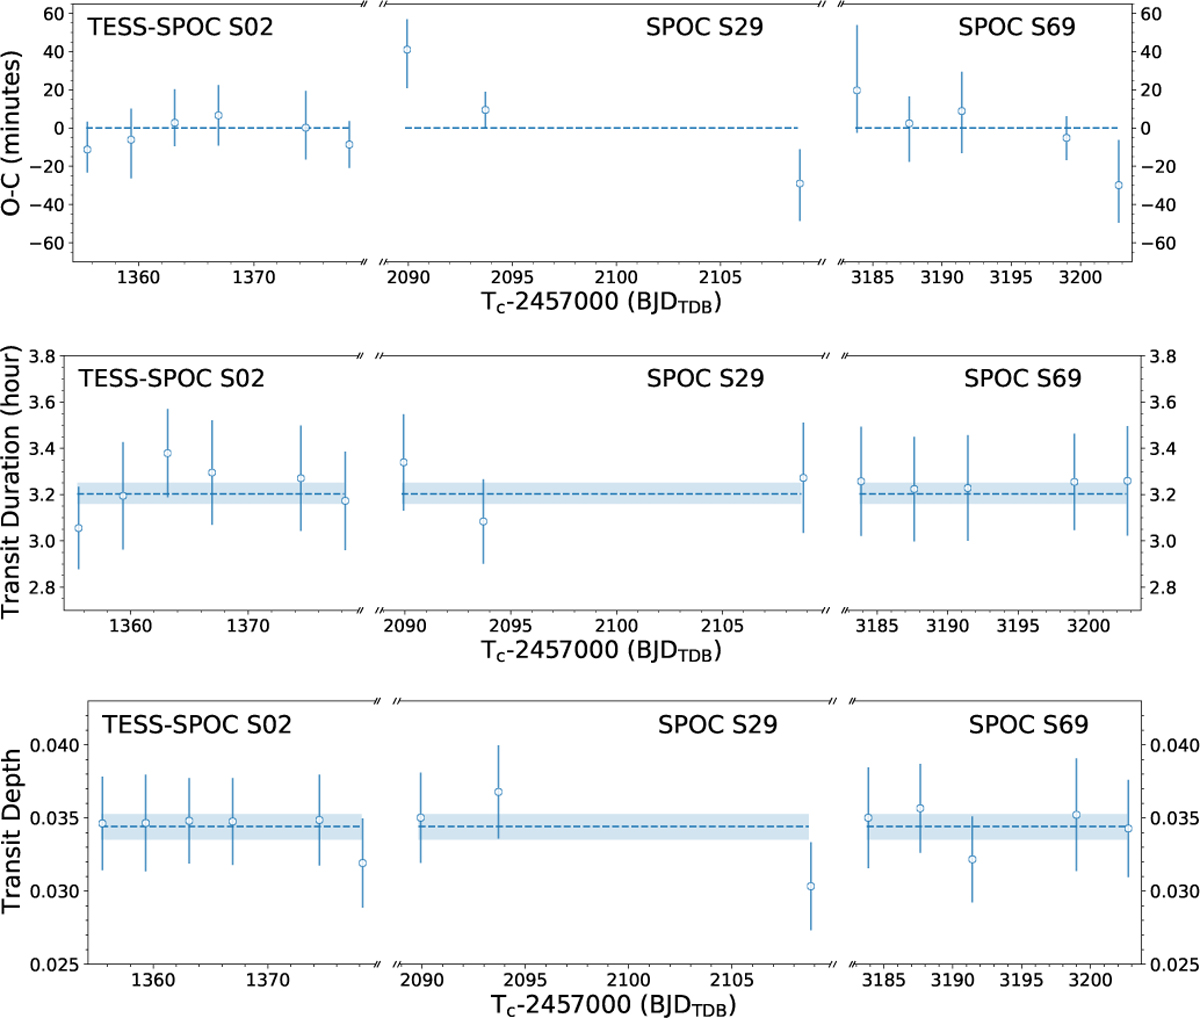
Top : transit-timing variation for the TESS mission. The open blue circles represent each transit time subtracted from the best-fitting linear ephemeris. The pipelines and sectors are labelled at the top. The abscissa was zoomed for better visualisation while avoiding the large gaps in the time domain. Centre : transit-duration variation. The dotted blue and shaded light blue regions represent the transit duration median and its 1σ confidence interval. Bottom : transit depth variation. The colour scheme is the same as above.
Current usage metrics show cumulative count of Article Views (full-text article views including HTML views, PDF and ePub downloads, according to the available data) and Abstracts Views on Vision4Press platform.
Data correspond to usage on the plateform after 2015. The current usage metrics is available 48-96 hours after online publication and is updated daily on week days.
Initial download of the metrics may take a while.