Fig. 10.
Download original image
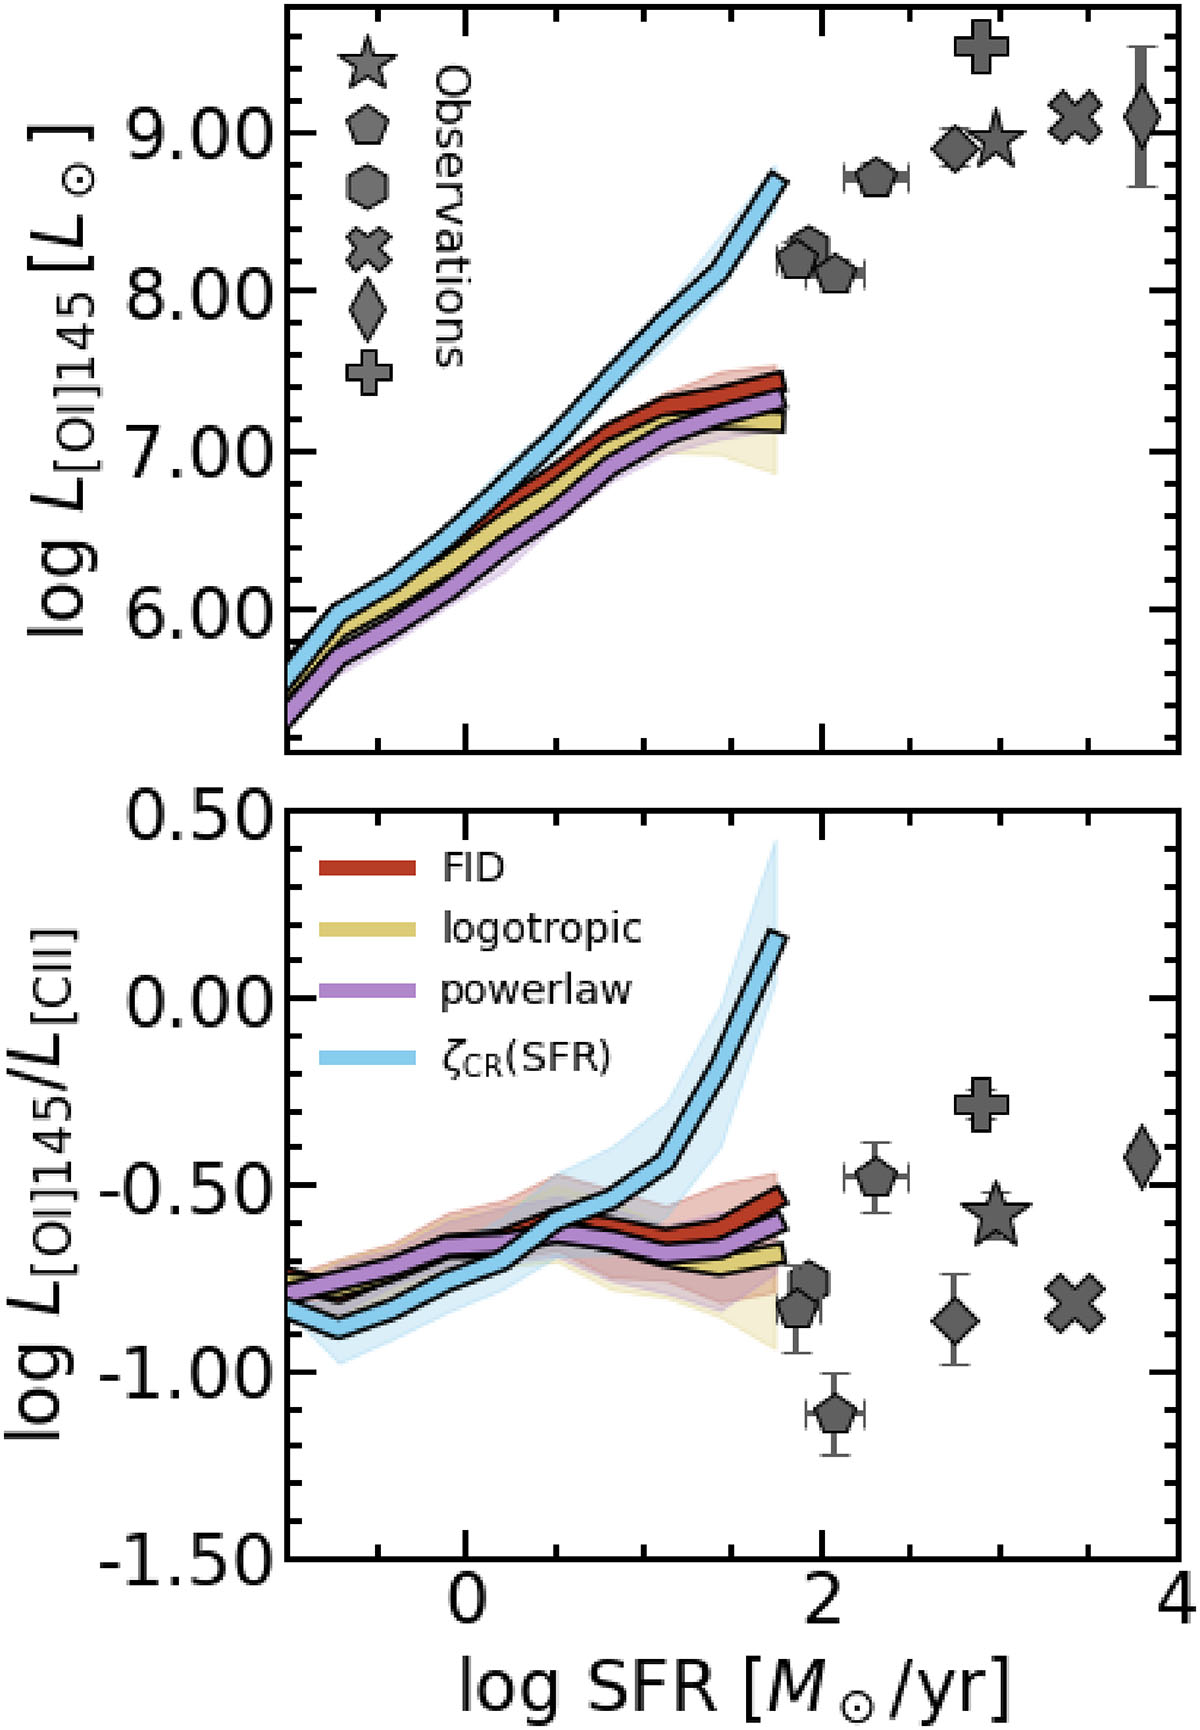
[OI] 145μm luminosity and [OI] 145μm/[CII] 158μm ratio as a function of SFR for our model galaxies at z = 6. Different colors refer to different model assumptions in the post-processing pipeline with DESPOTIC. The red one represents the fiducial model adopted in this work, the cyan is a model where the CRs rate is scaled with the SFR density, the yellow and purple are models where the density profile is assumed to be logotropic and power-law. Solid lines refer to median trends and shaded regions indicate the 16th to 84th percentile dispersion. For reference, the available z ≳ 5 observations discussed in this work are also reported, with the same symbols as in Figs. 6 and 7.
Current usage metrics show cumulative count of Article Views (full-text article views including HTML views, PDF and ePub downloads, according to the available data) and Abstracts Views on Vision4Press platform.
Data correspond to usage on the plateform after 2015. The current usage metrics is available 48-96 hours after online publication and is updated daily on week days.
Initial download of the metrics may take a while.