Open Access
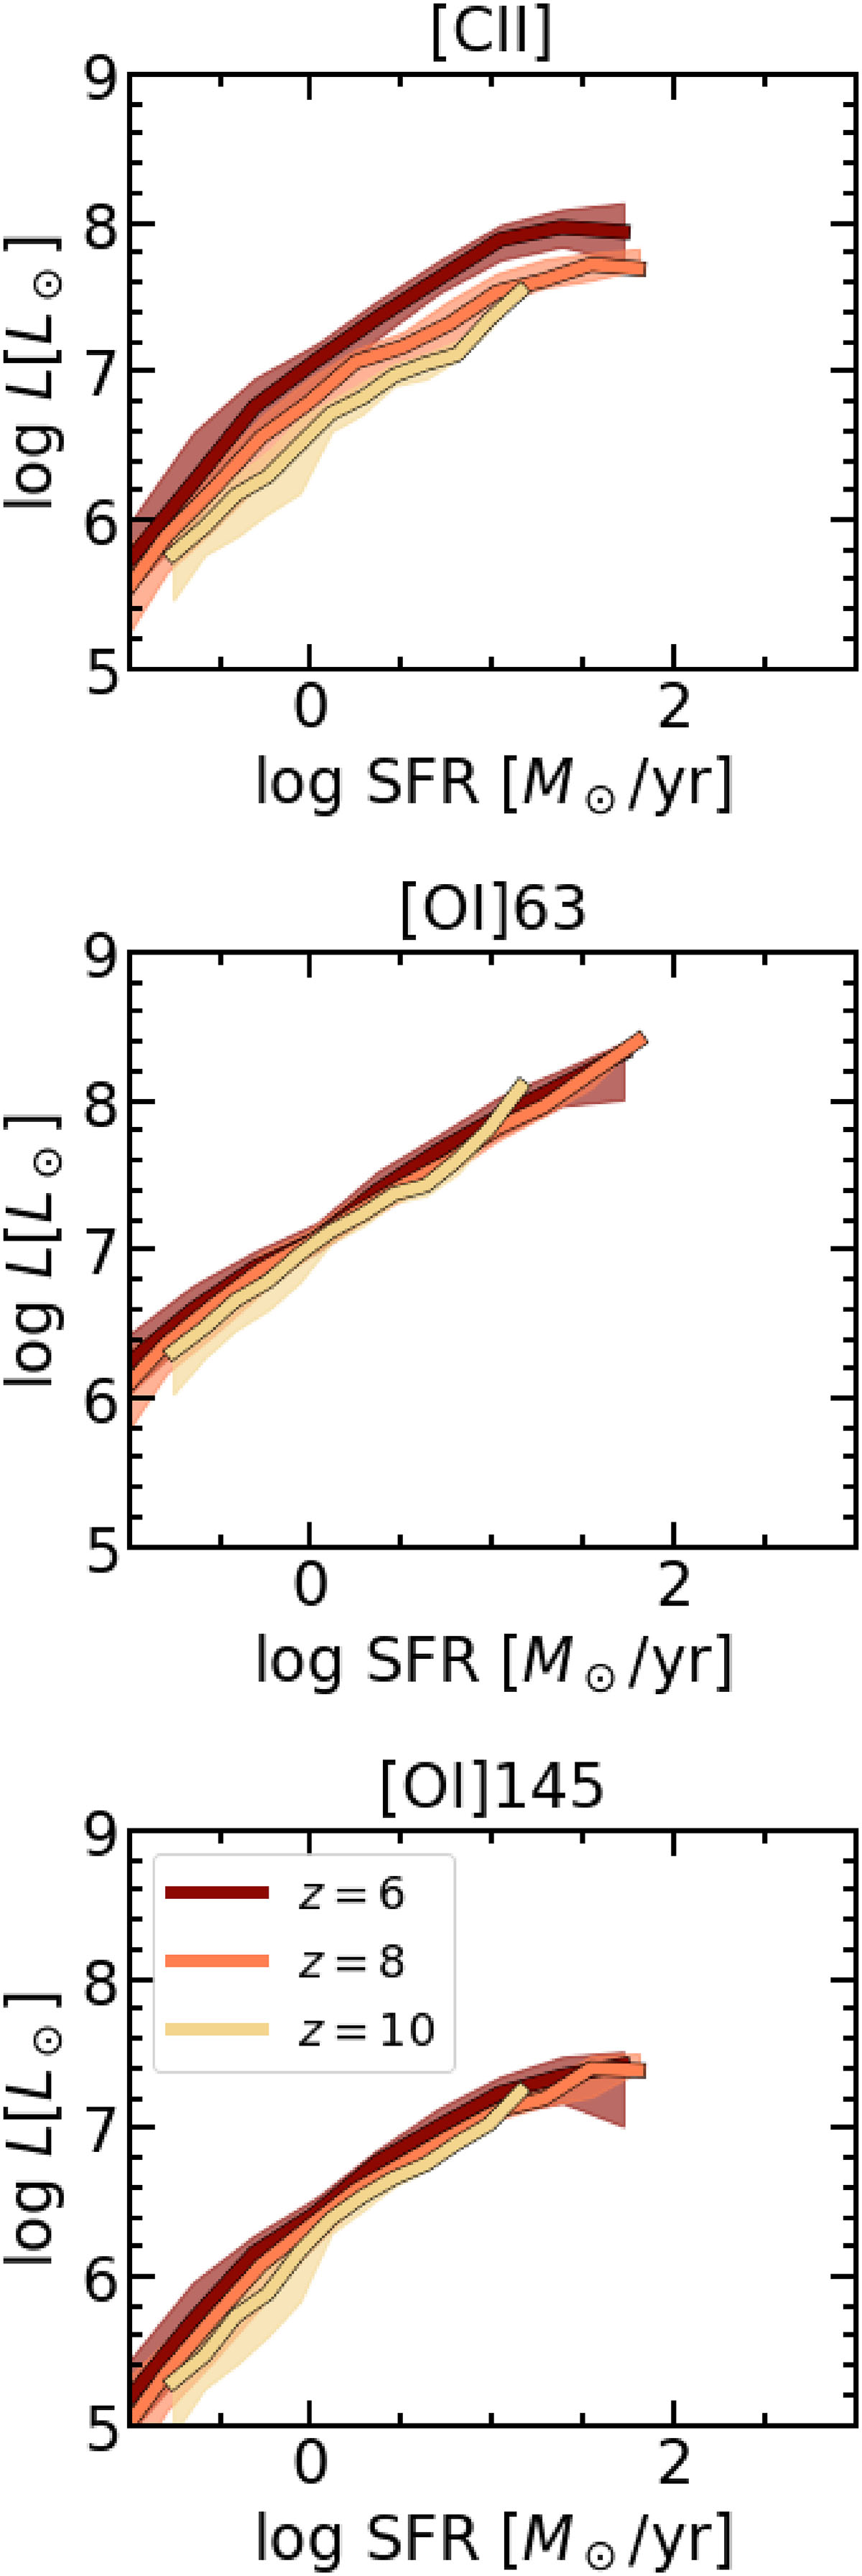
Fig. C.1.
Download original image
Relation between SFR and [CII] 158μm, [OI] 63μm and [OI] 145μm luminosity for our simulated galaxies at z = 6, 8, and 10. Solid lines refer to median trends, while shaded regions are 16th to 84th percentile dispersion.
Current usage metrics show cumulative count of Article Views (full-text article views including HTML views, PDF and ePub downloads, according to the available data) and Abstracts Views on Vision4Press platform.
Data correspond to usage on the plateform after 2015. The current usage metrics is available 48-96 hours after online publication and is updated daily on week days.
Initial download of the metrics may take a while.