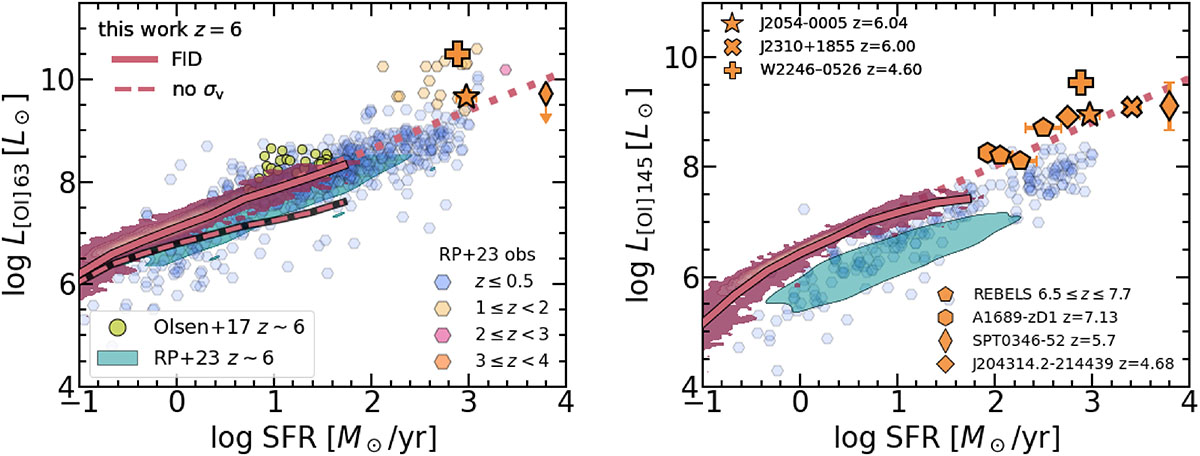
Fig. 6.
Download original image
Relation between [OI] 63μm (left panel) and [OI] 145μm (right panel) line luminosity and SFR. Our simulation results at z = 6 are shown as red density contours, with solid lines representing median trends. The median trend of the model with self-absorption neglecting the Eq. (4) condition is shown as a dashed line. Dotted lines are linear fits of the simulation results, with coefficients listed in Section 4.3. Other z ∼ 6 predictions for [OI] 63μm luminosity obtained from the post-processing of numerical simulations are also reported: Olsen et al. (2017) as blue circles and Ramos Padilla et al. (2023) as a turquoise area. Some observations are also reported for reference. The data up to z = 4 compiled by Ramos Padilla et al. (2023) are shown as hexagons. The J2054-00005 at z = 6.04 (Ishii et al. 2025) and W2246-0526 at z = 4.60 (Fernández Aranda et al. 2024) have both [OI] 63μm and [OI] 145μm detections. As for [OI] 145μm, we include the recent 6.5 ≤ z ≤ 7.7 REBELS observations (Fudamoto et al. 2025), the z = 6.00 J2310+1855 QSO (Li et al. 2020), and the new data obtained in this work (A1689-zD1 at z = 7.13, SPT0346−52 at z = 5.7 and J204313.2-214439 at z = 4.68; see Sect. 3).
Current usage metrics show cumulative count of Article Views (full-text article views including HTML views, PDF and ePub downloads, according to the available data) and Abstracts Views on Vision4Press platform.
Data correspond to usage on the plateform after 2015. The current usage metrics is available 48-96 hours after online publication and is updated daily on week days.
Initial download of the metrics may take a while.