Fig. 7.
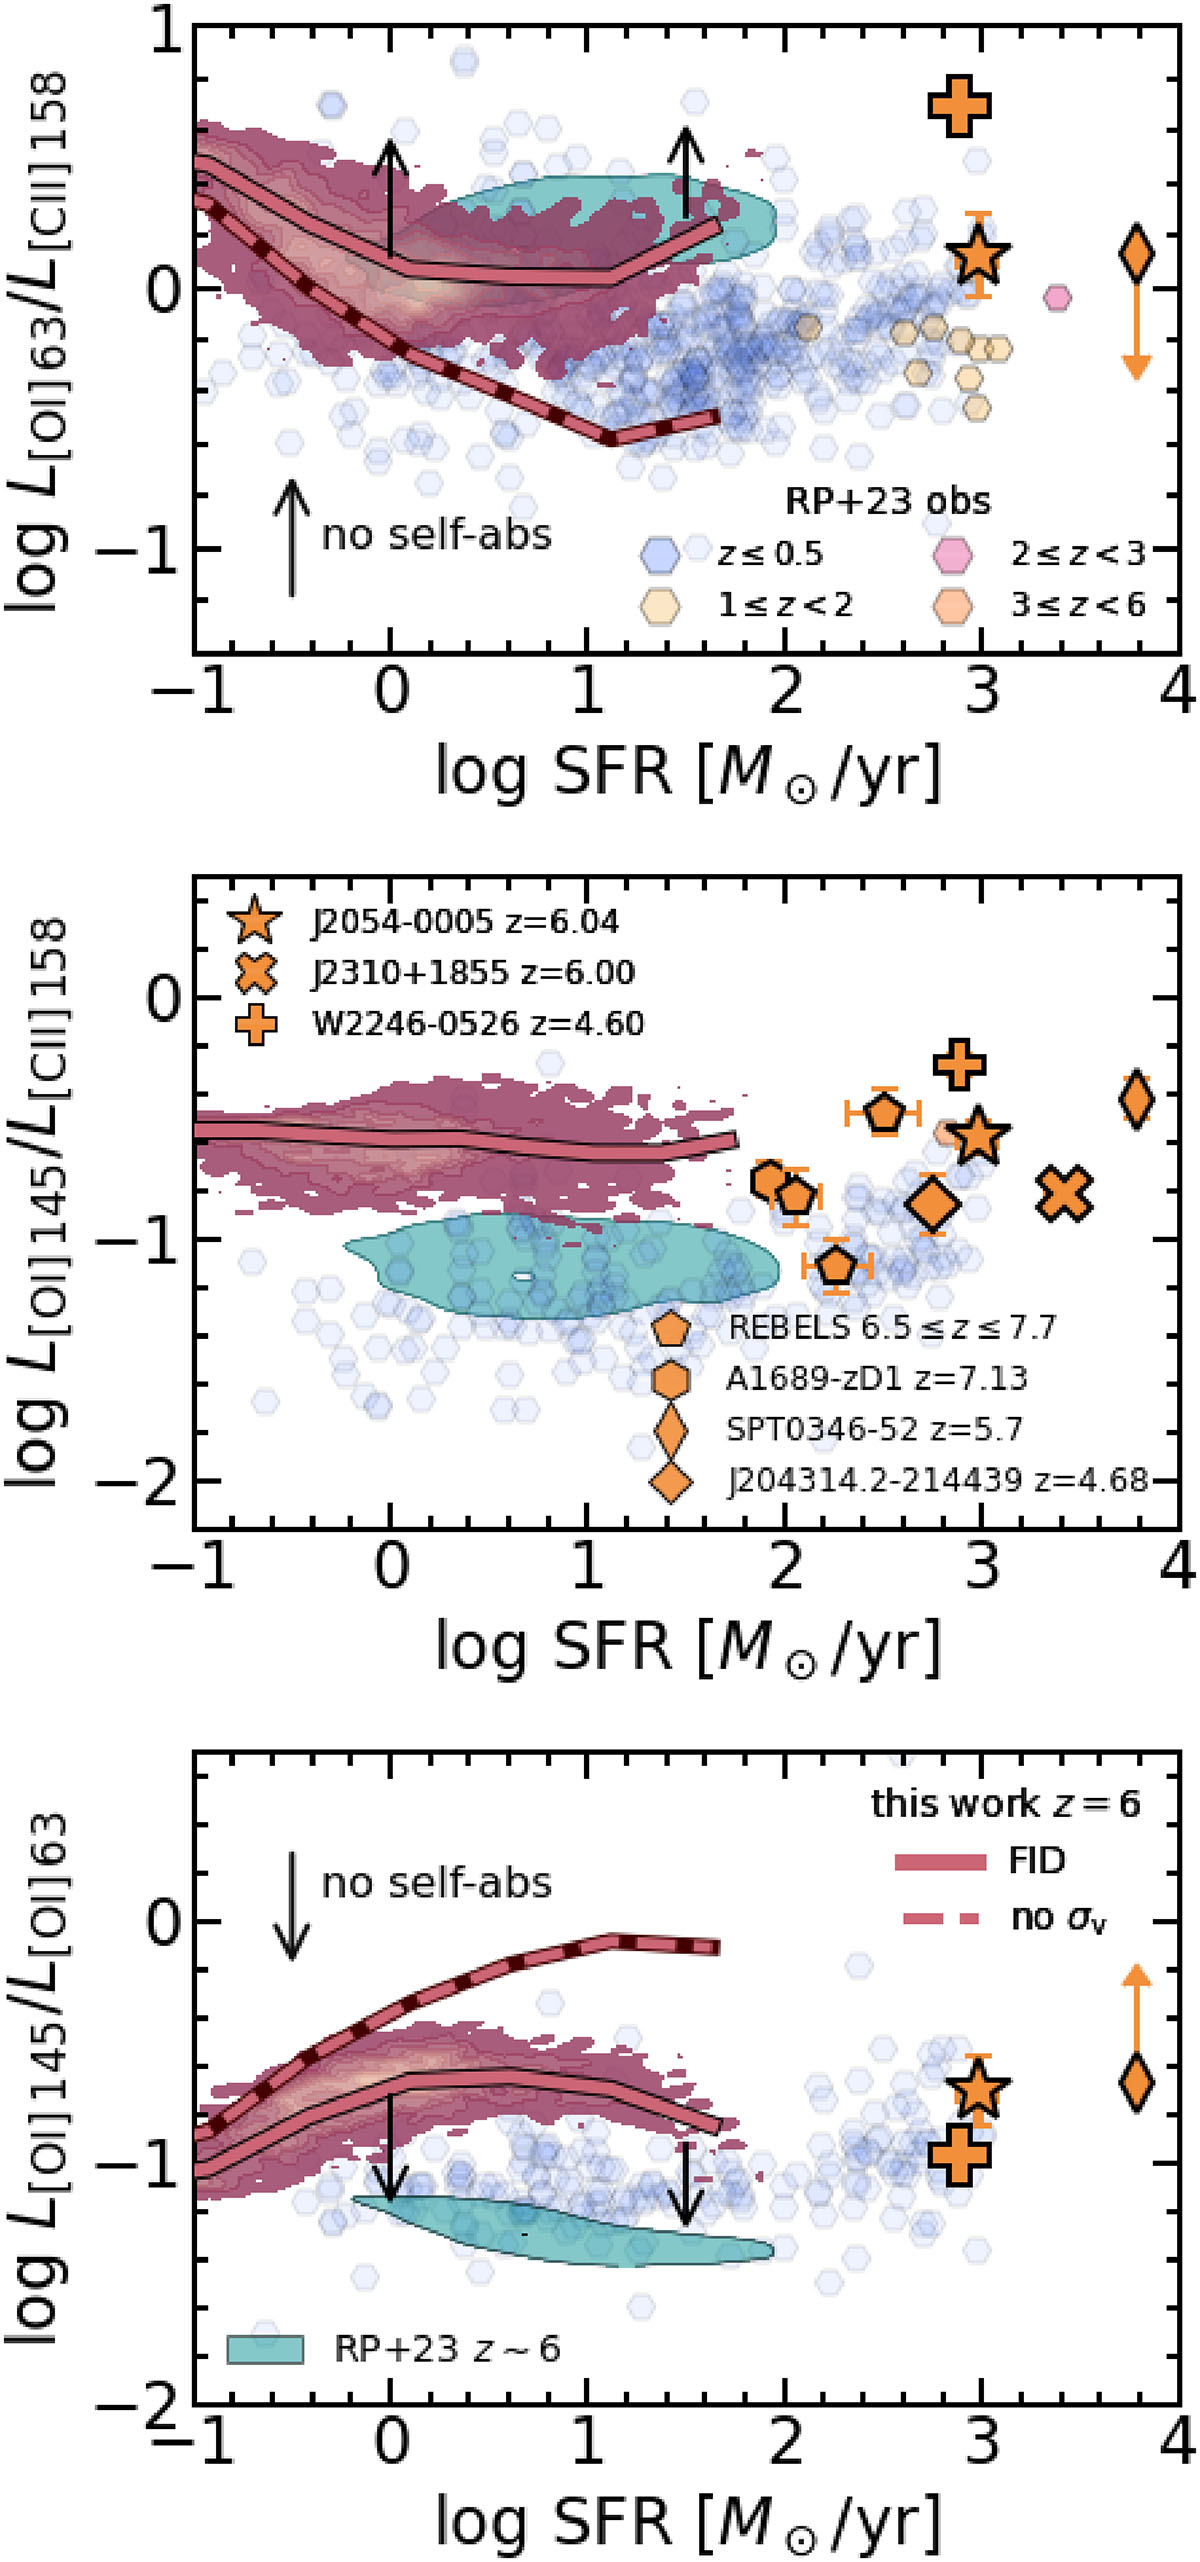
Download original image
Line ratios as a function of SFR: [OI] 63μm/[CII] 158μm (top), [OI] 145μm/[CII] 158μm (middle) and [OI] 145μm/[OI] 63μm (bottom). Our simulation results at z = 6 are shown with red contours, with the solid line representing median trend. The median trend of the model with self-absorption neglecting the Eq. (4) condition is shown as a dashed line. The black arrows indicate the magnitude of the [OI] 63μm self-absorption by foreground gas as predicted by our model. Simulation predictions by Ramos Padilla et al. (2023) at z ∼ 6 are shown as turquoise contours. The same observational data shown in Fig. 6 are included where detections are available, as described in the legend.
Current usage metrics show cumulative count of Article Views (full-text article views including HTML views, PDF and ePub downloads, according to the available data) and Abstracts Views on Vision4Press platform.
Data correspond to usage on the plateform after 2015. The current usage metrics is available 48-96 hours after online publication and is updated daily on week days.
Initial download of the metrics may take a while.