Fig. 8.
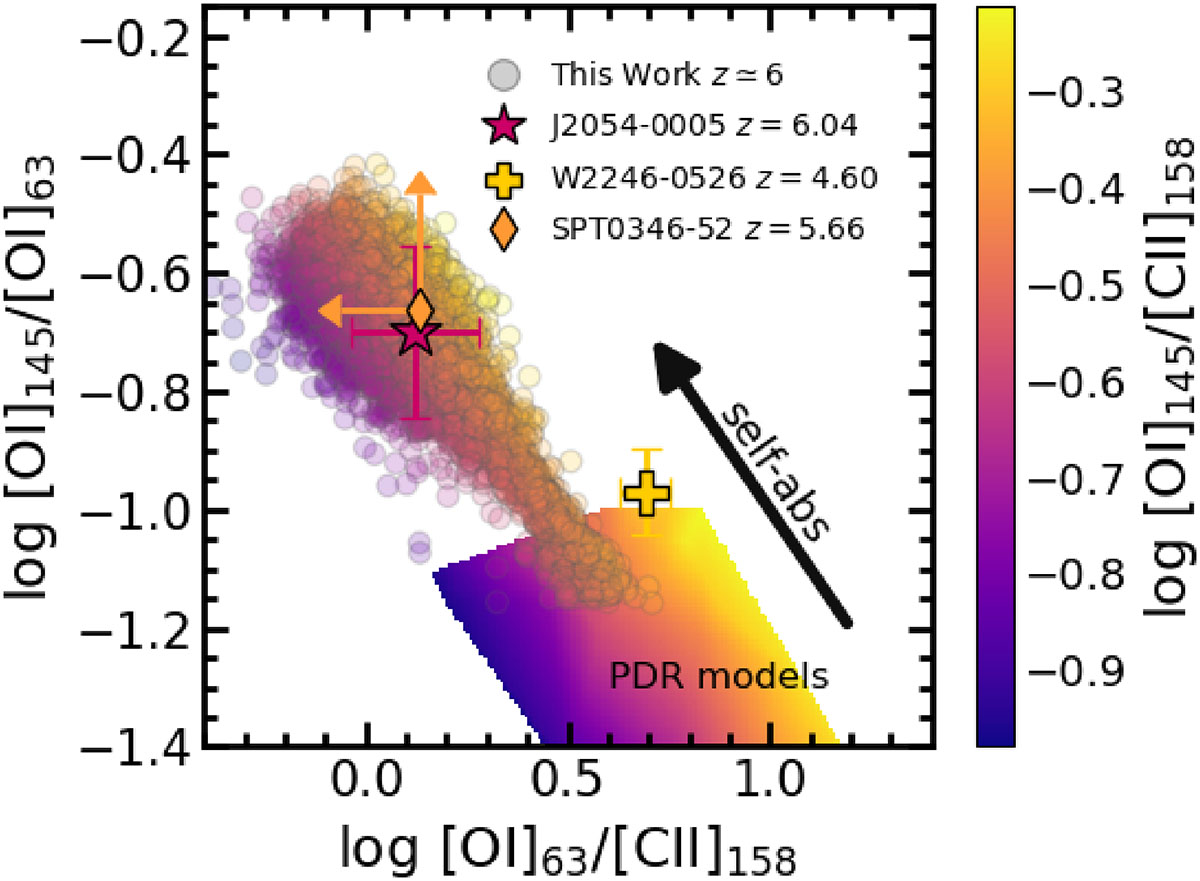
Download original image
Distribution of the [OI] 145μm/[OI] 63μm and [OI] 63μm/[CII] 158μm line ratios for different values of [OI] 145μm/[CII] 158μm, as shown in the colorbar. The colored region represents the outcome of the PDR DESPOTIC computations assuming homogeneous clouds with 102 ≤ nH/cm−3 ≤ 106 and 20 ≤ T/K ≤ 104. Our simulated z ≃ 6 galaxies are shown as circles, J2054-0005 as a star, W2246-0526 as a plus and the SPT0346−52 upper limit as a diamond. The black arrow illustrates the typical shift due to [OI] 63μm foreground self-absorption.
Current usage metrics show cumulative count of Article Views (full-text article views including HTML views, PDF and ePub downloads, according to the available data) and Abstracts Views on Vision4Press platform.
Data correspond to usage on the plateform after 2015. The current usage metrics is available 48-96 hours after online publication and is updated daily on week days.
Initial download of the metrics may take a while.