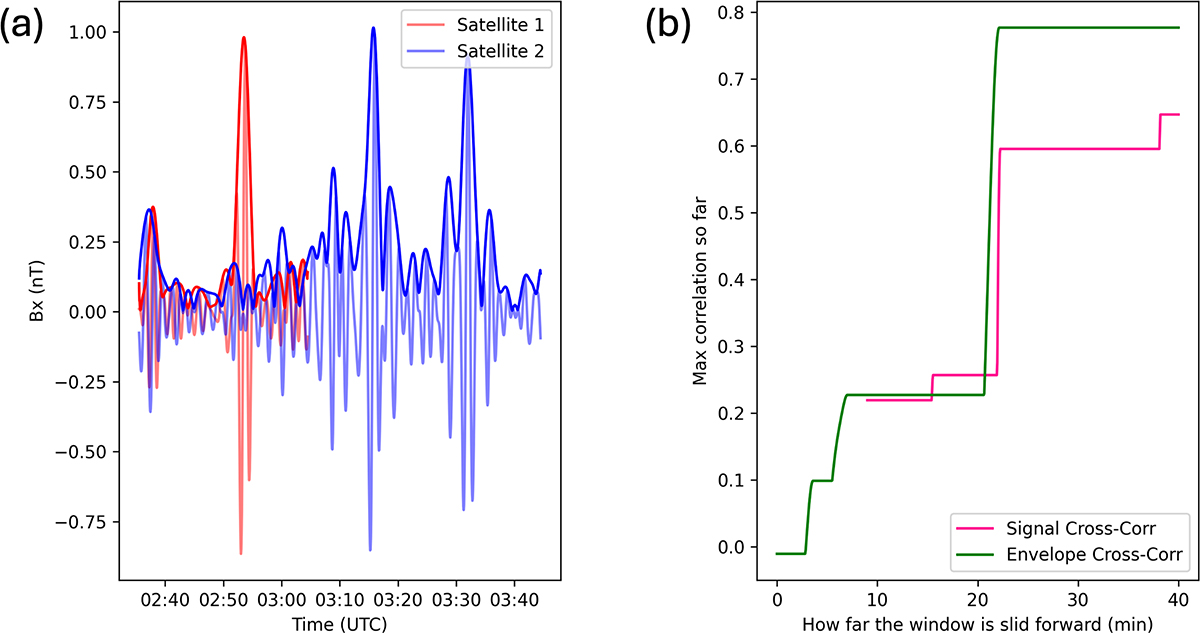
Fig. 1.
Download original image
Illustrative example of our time-lagged cross-correlation method. The two satellites’ magnetic field time series are shown in panel (a) starting on May 24th, 2011 at 2:36 UTC. The magnetic field time series recorded by the satellite closer to the sun (Wind; Satellite 1) is slid across the second satellite’s measurements, calculating the correlation between the two signals at each point. Panel (a) also includes the signal envelopes for each time series for ease of visual comparison (darker-colored lines). Panel (b) shows the maximum correlation recorded up to that point for each time delay, for both the magnetic field time-series (pink) and signal envelopes (green). We define the time lag between signals to be where there is the greatest improvement in correlation between the signals, and the coherence to be the correlation at that point (in this case, a correlation of 0.595 at a lag of 22 min).
Current usage metrics show cumulative count of Article Views (full-text article views including HTML views, PDF and ePub downloads, according to the available data) and Abstracts Views on Vision4Press platform.
Data correspond to usage on the plateform after 2015. The current usage metrics is available 48-96 hours after online publication and is updated daily on week days.
Initial download of the metrics may take a while.