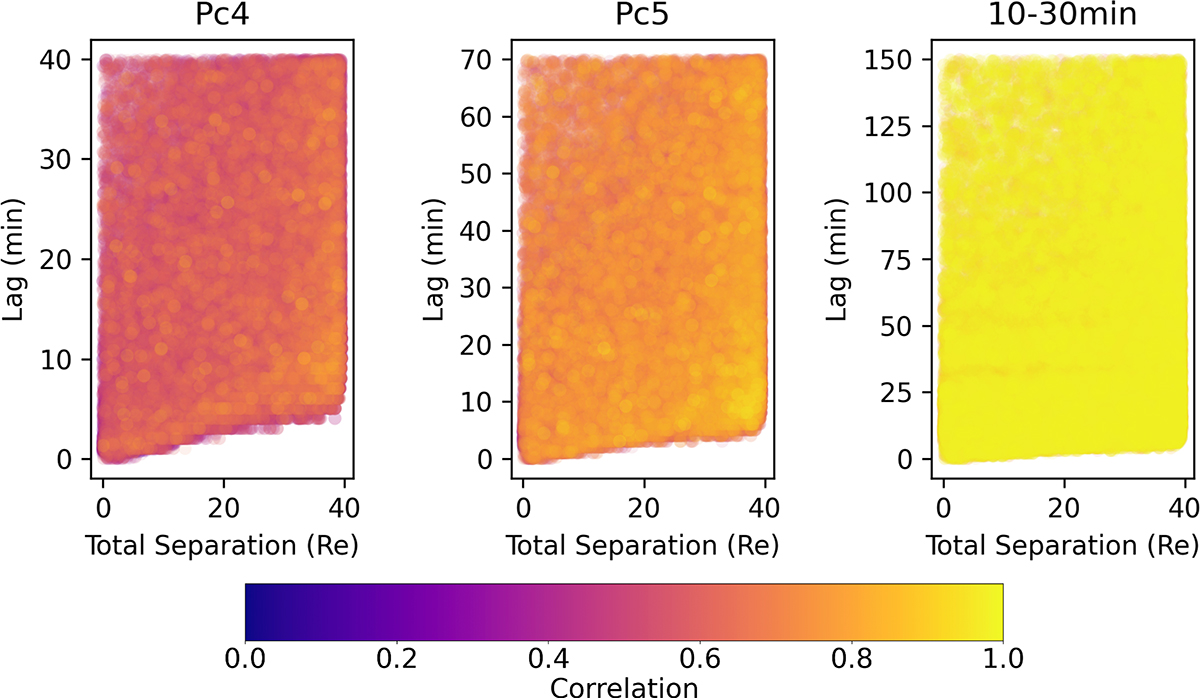
Fig. 2.
Download original image
Spatiotemporal heatmaps of radial ACE-Wind magnetic coherence observed at L1. Each panel corresponds to fluctuations within a given frequency range of magnetic field fluctuations: Pc4 (1–2.5 min), Pc5 (2.5–10 min periods), and 10–30 min periods. For each plot, the x-axis represents radial spacecraft separation and the y-axis represents the time lag between signals recorded at each satellite. The color intensity of each point represents the coherence observed at that particular temporal and spatial lag, as determined by our max-step correlation function. Each plot contains 10 000 observations across various plasma conditions and solar cycle phases, so opacity is adjusted to emphasize higher concentrations of high-coherence observations.
Current usage metrics show cumulative count of Article Views (full-text article views including HTML views, PDF and ePub downloads, according to the available data) and Abstracts Views on Vision4Press platform.
Data correspond to usage on the plateform after 2015. The current usage metrics is available 48-96 hours after online publication and is updated daily on week days.
Initial download of the metrics may take a while.