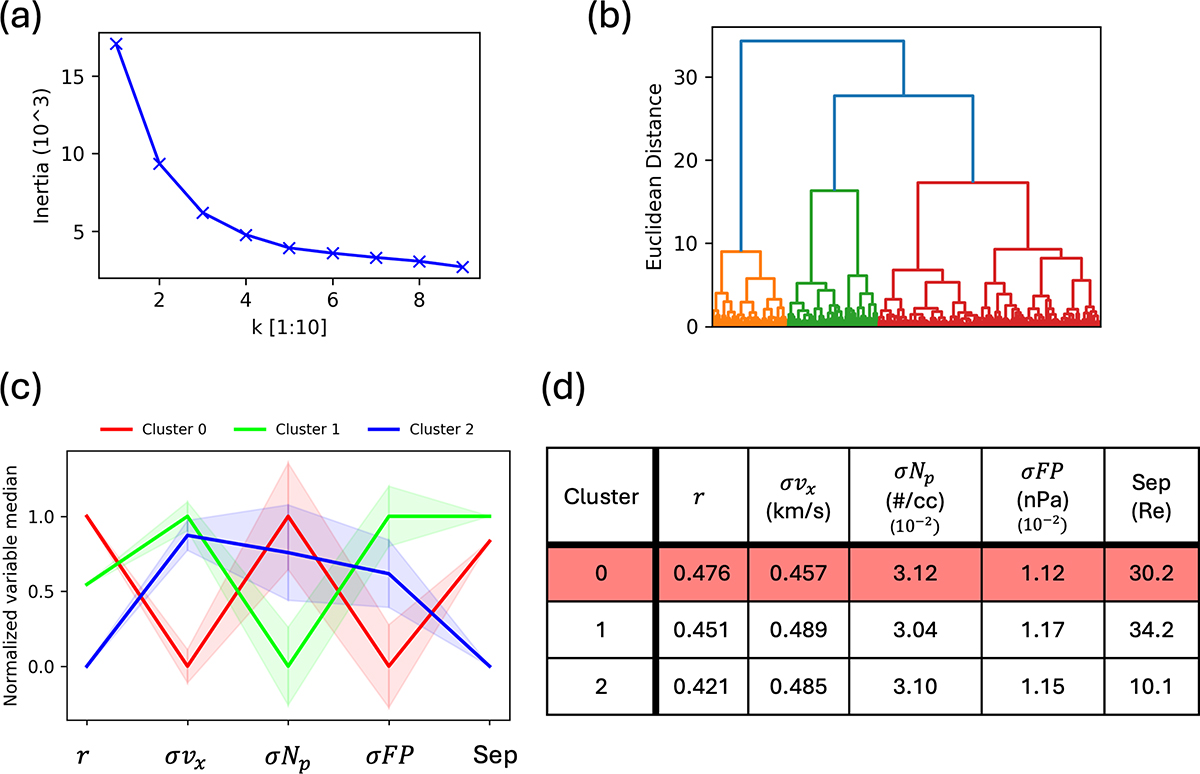
Fig. 3.
Download original image
Clustering results for fluctuations in the Pc4 range (1–2.5 min periods). Panel (a) shows an elbow plot, in which within-cluster error is displayed as a function of cluster number. Panel (b) displays the agglomerative clustering dendrogram, in which Euclidean distance indicates the similarity between clusters. We selected three main clusters. Panel (c) is a parallel plot of the clustering results. Within each of the three clusters, the median of each variable is calculated and plotted on a normalized scale (the displayed values are not the actual values), along with a statistical error margin defined by the standard error. Each colored line represents a cluster and displays the defining characteristics of each cluster. Panel (d) shows the non-normalized values plotted in the parallel plot, with the cluster with highest median coherence highlighted in red. Here, r represents the cross-correlation, σvx represents the median standard deviation of the plasma velocity in the x-direction, σNp represents the median s.d. of the proton density, σFP is the median s.d. of the flow pressure, and Sep. represents the median satellite separation for each cluster.
Current usage metrics show cumulative count of Article Views (full-text article views including HTML views, PDF and ePub downloads, according to the available data) and Abstracts Views on Vision4Press platform.
Data correspond to usage on the plateform after 2015. The current usage metrics is available 48-96 hours after online publication and is updated daily on week days.
Initial download of the metrics may take a while.