Fig. 5.
Download original image
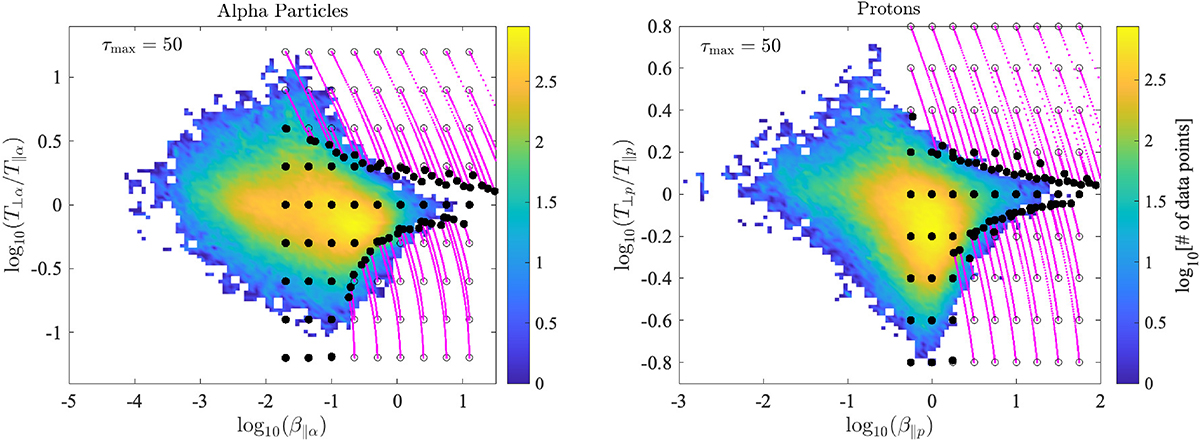
[Left] Initial ensemble of alpha particle data points in the case of relaxation by instability excitation (plotted with open circles). The dynamic paths in (β∥α, T⊥α/T∥α) space are indicated with magenta curves and the final states at τmax = Ωptmax = 50 are marked with black dots. The background shows the alpha particle data distribution. [Right] Same but for the protons. An associated movie showing the entire dynamic paths for the ensemble points that are subject to instability excitation and quasi-linear relaxation is available online.
Current usage metrics show cumulative count of Article Views (full-text article views including HTML views, PDF and ePub downloads, according to the available data) and Abstracts Views on Vision4Press platform.
Data correspond to usage on the plateform after 2015. The current usage metrics is available 48-96 hours after online publication and is updated daily on week days.
Initial download of the metrics may take a while.