Fig. 1
Download original image
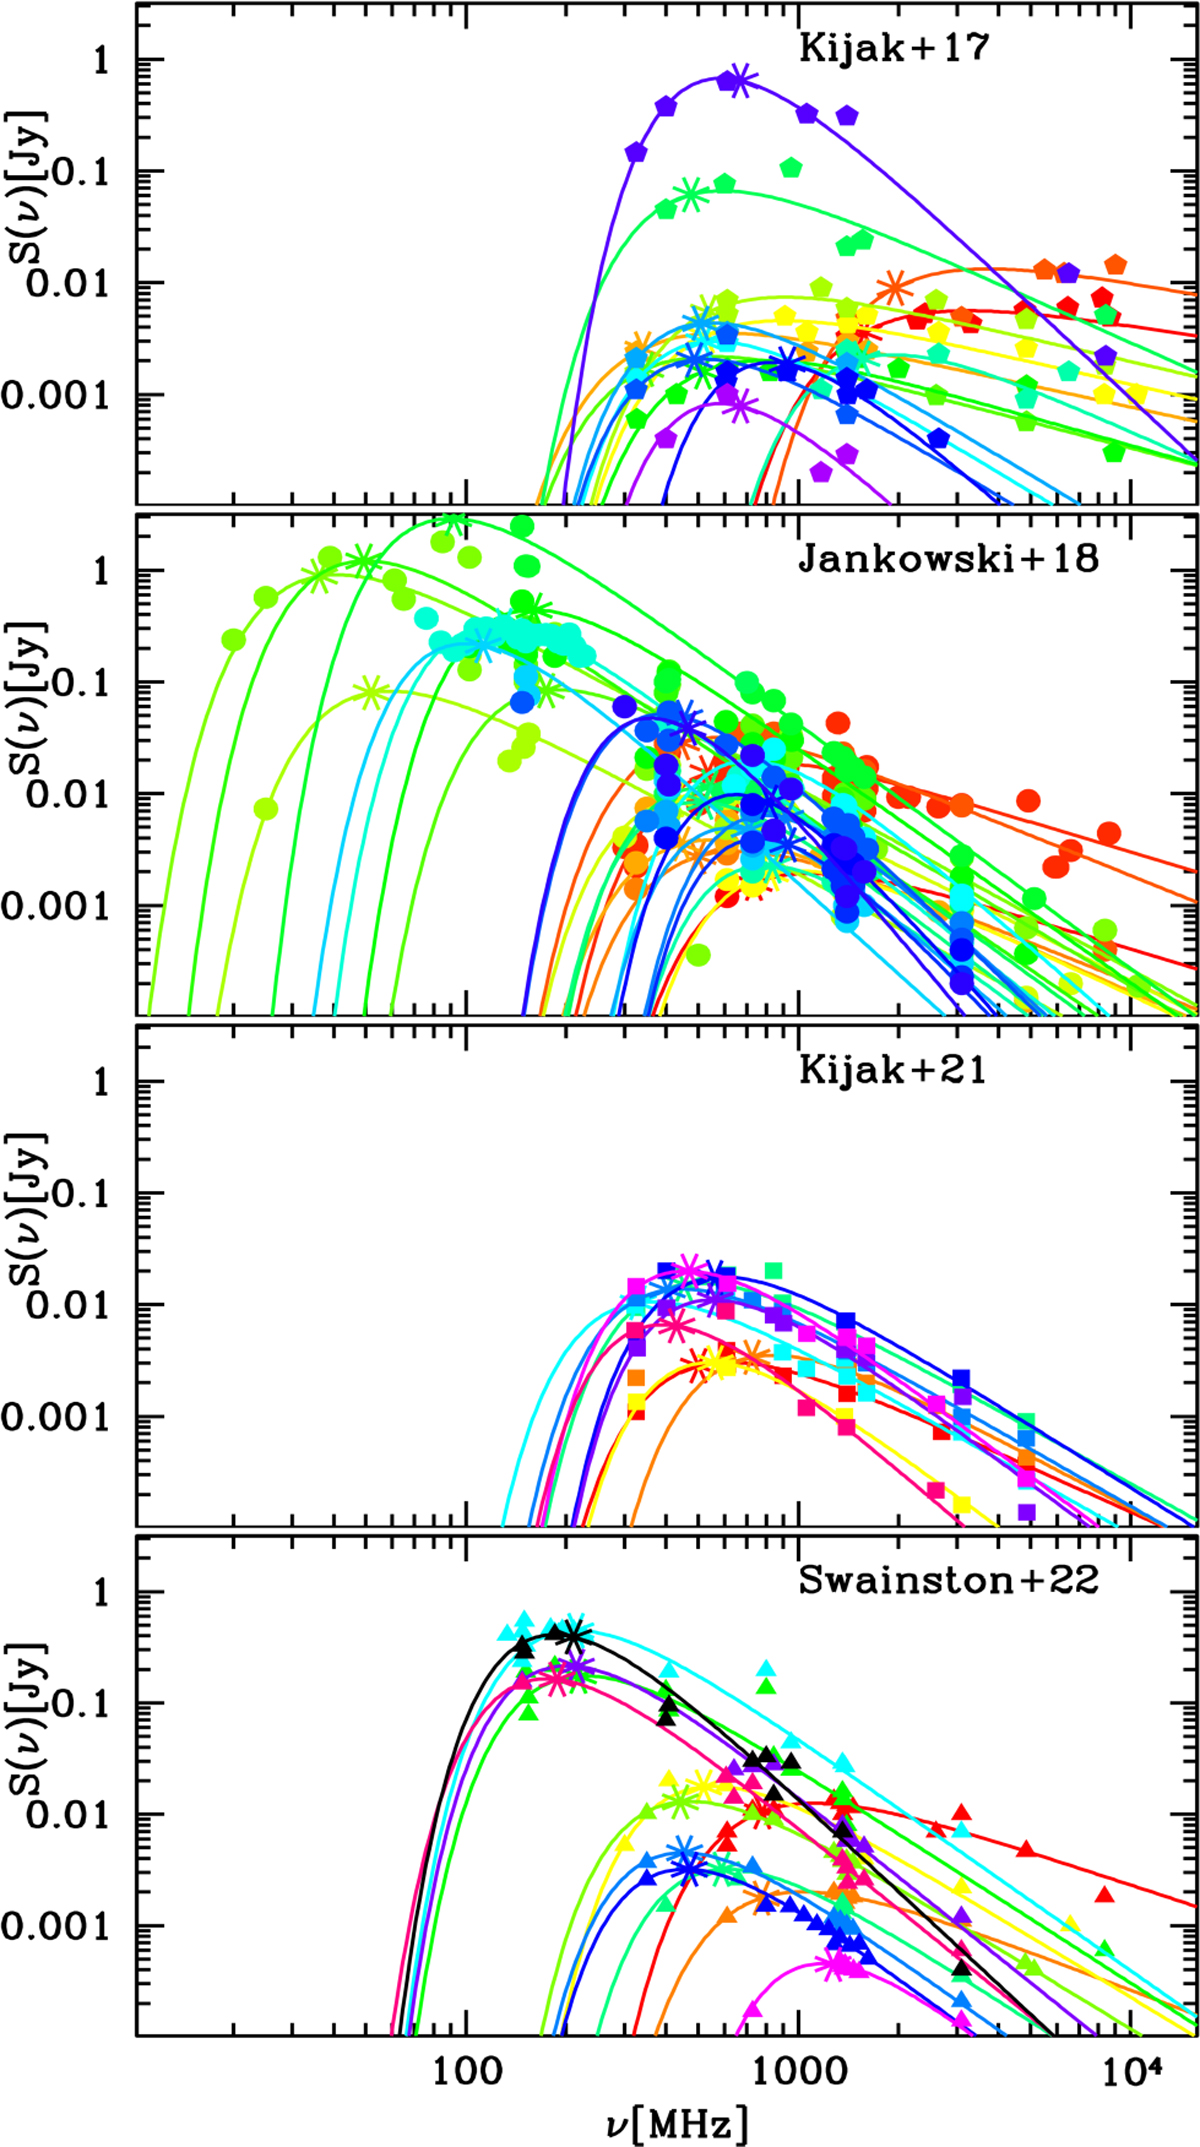
Radio flux density measurements (coloured filled symbols) vs frequency for the four PSR subsamples analysed in our study. The panels, from top to bottom, display 15 spectra from K17, 25 from J18, 10 from K21, and 13 from S22. The solid coloured lines represent the best-fit models derived from Eq. (4) using spectral indices reported in the literature referenced in our work (see Table A.1 for the parameter values). Asterisks mark the characteristic frequency, ν∗, for each individual spectrum.
Current usage metrics show cumulative count of Article Views (full-text article views including HTML views, PDF and ePub downloads, according to the available data) and Abstracts Views on Vision4Press platform.
Data correspond to usage on the plateform after 2015. The current usage metrics is available 48-96 hours after online publication and is updated daily on week days.
Initial download of the metrics may take a while.