Fig. 10
Download original image
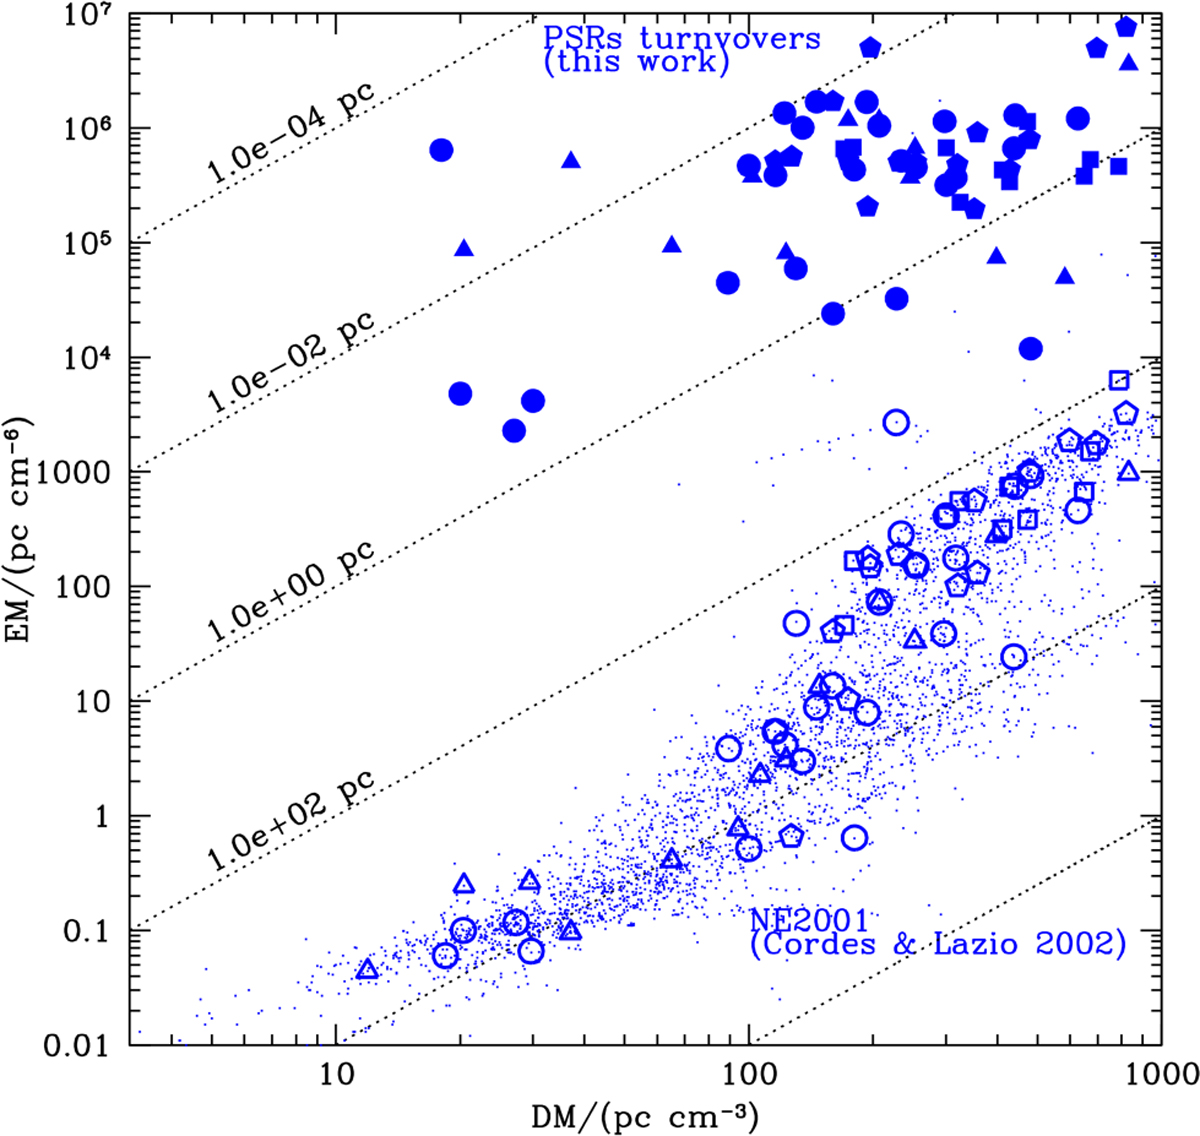
EMs plotted against DMs for the 63 PSRs included in our sample. Filled symbols correspond to EMs values derived from radio continuum spectral turnovers in K17 (pentagons), J18 (circles), K21 (squares), and S22 (triangles). Open blue symbols represent EMs values predicted by the NE2001 model (Cordes & Lazio 2002, 2003) for our collection of PSRs, while the smallest blue points indicate values derived for all PSRs in the ATNF catalogue. The diagonal dotted lines show the relationship for constant size values, as labelled.
Current usage metrics show cumulative count of Article Views (full-text article views including HTML views, PDF and ePub downloads, according to the available data) and Abstracts Views on Vision4Press platform.
Data correspond to usage on the plateform after 2015. The current usage metrics is available 48-96 hours after online publication and is updated daily on week days.
Initial download of the metrics may take a while.