Fig. 11
Download original image
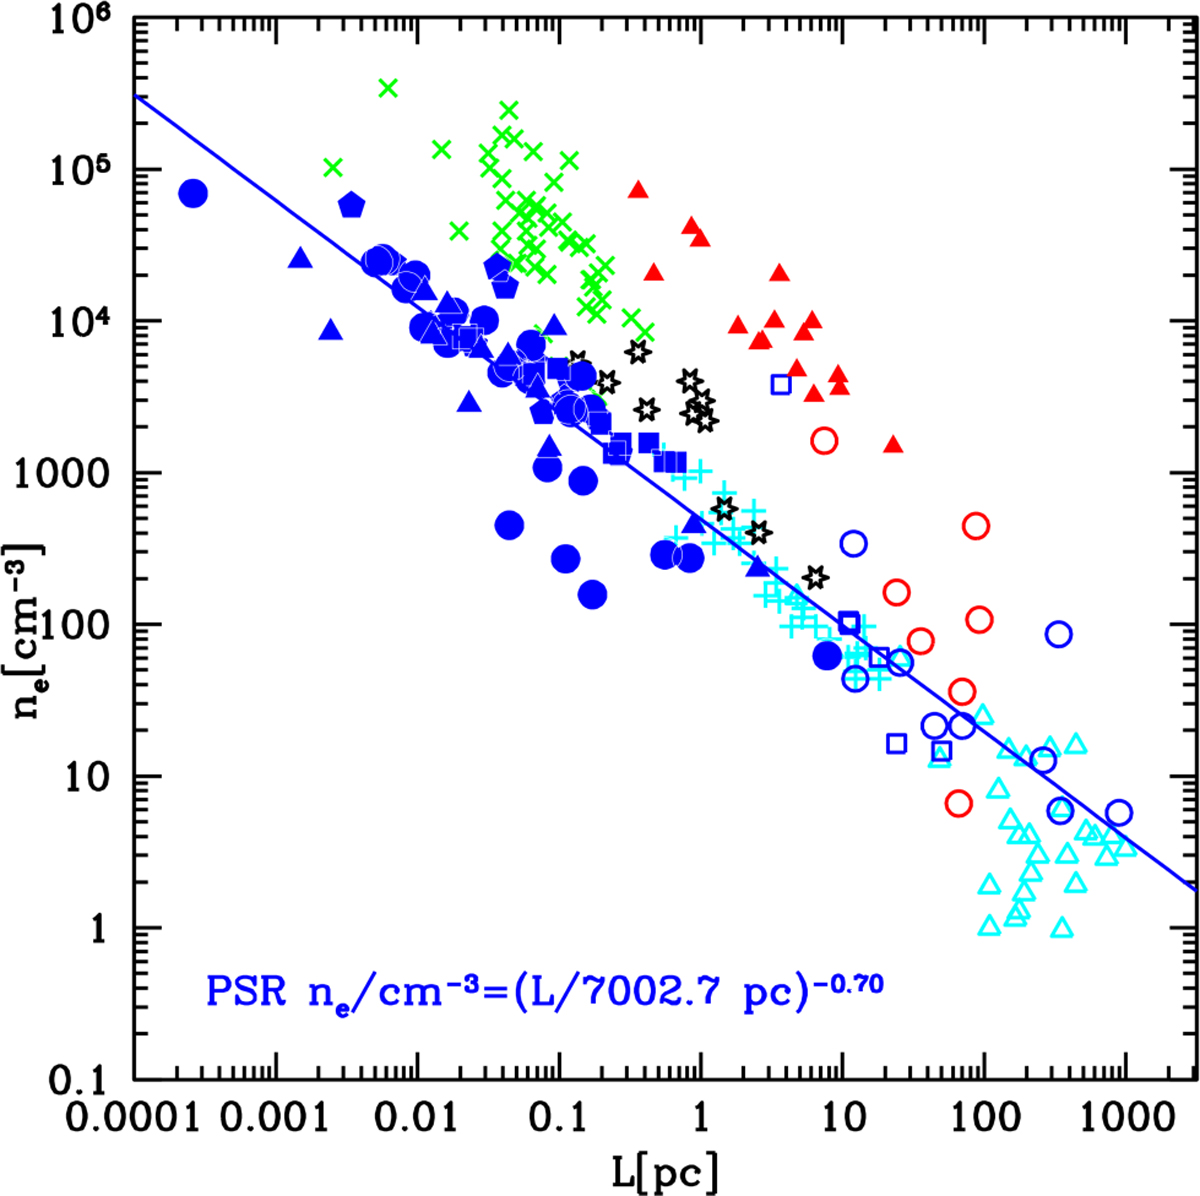
Relation between the electron number density, ne, and the size, L, of the absorber population causing turnovers at ν* < 2 GHz in our sample of 63 PSR radio continuum spectra, modelled by a power law with a turnover due to free-free thermal absorption. Filled blue symbols represent data from PSR spectra in K17 (pentagons), J18 (circles), K21 (squares), and S22 (triangles). The solid blue line represents the least-squares fit to the PSR data, ne ∝ L−0.70, assuming an electron temperature of the ionised gas Te = 8000 K. The graphic also reproduces the data points from Fig. 2 of Hunt & Hirashita (2009), corresponding to Galactic ultracompact (cyan plus symbols), compact (green crosses), and giant (open cyan triangles) H ii regions, along with different extragalactic H ii region samples: radio galaxies (filled red triangles), Small and Large Magellanic Clouds (black open stars), M33 (open blue squares), Zw18 (filled blue triangles), dwarf galaxies observed with HST (open red and blue circles), and spiral and irregular galaxies (open cyan triangles). The correlation we find between the size and density of the PSR radio emission absorbers is consistent with that observed in Galactic and extragalactic H ii regions (ne ∝ L−1).
Current usage metrics show cumulative count of Article Views (full-text article views including HTML views, PDF and ePub downloads, according to the available data) and Abstracts Views on Vision4Press platform.
Data correspond to usage on the plateform after 2015. The current usage metrics is available 48-96 hours after online publication and is updated daily on week days.
Initial download of the metrics may take a while.