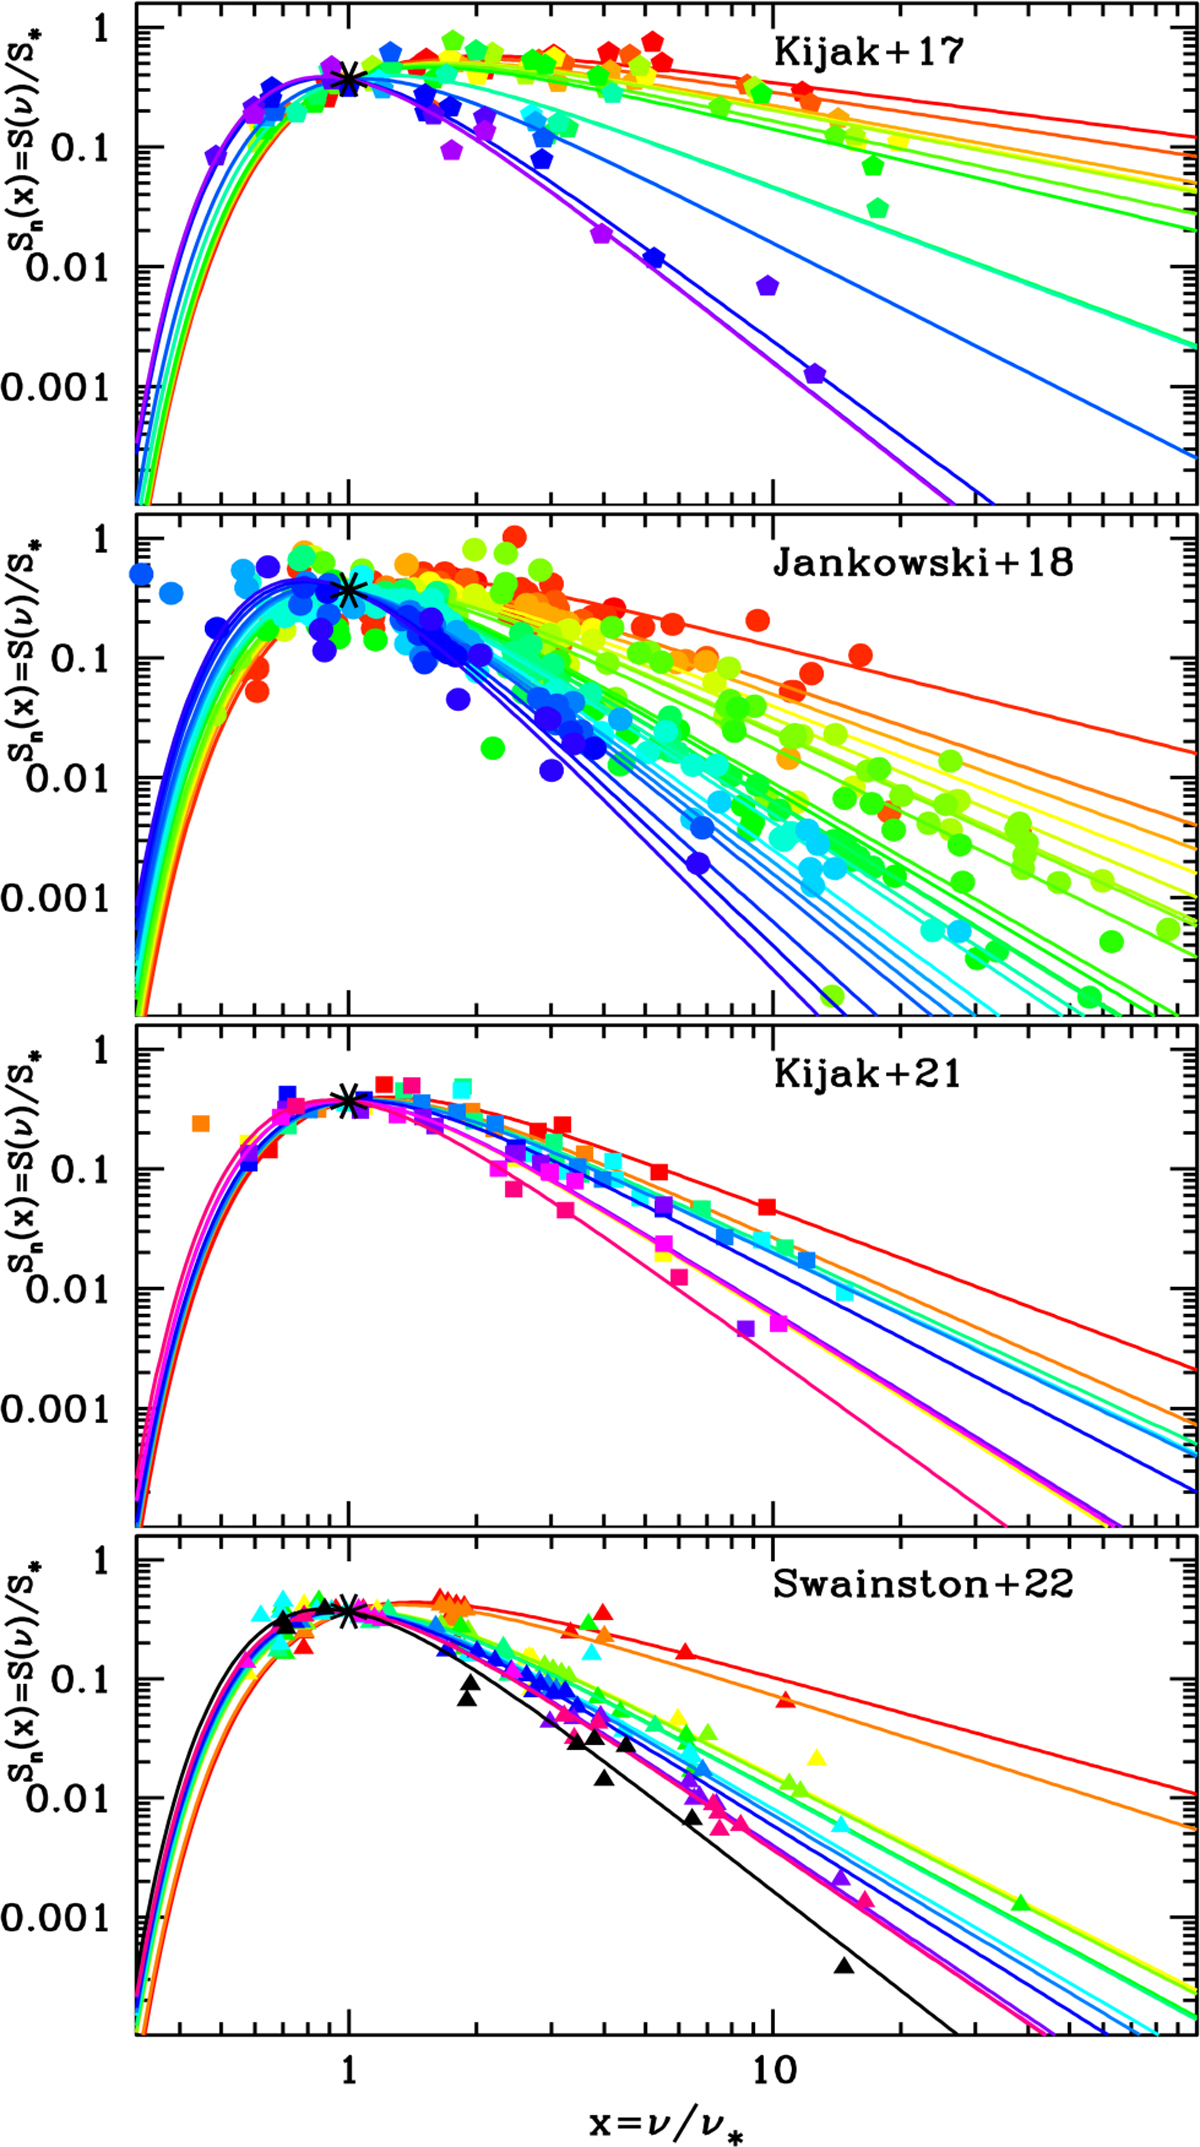
Fig. 2
Download original image
Normalised radio flux density as a function of normalised frequency for our PSR sample, comprising (from top to bottom) 15 objects reported in K17, 25 in J18, 10 in K21, and 13 in S22. Each PSR within the subsamples is colour-coded individually. The solid lines represent the fitted models, with parameters listed in Table A.1, and the black asterisk indicates the characteristic frequency, ν*. This normalisation process highlights the similar exponential drop-off in the spectra associated with ν∗ values, arranging PSR spectra in increasing order based on the slope of their emission.
Current usage metrics show cumulative count of Article Views (full-text article views including HTML views, PDF and ePub downloads, according to the available data) and Abstracts Views on Vision4Press platform.
Data correspond to usage on the plateform after 2015. The current usage metrics is available 48-96 hours after online publication and is updated daily on week days.
Initial download of the metrics may take a while.