Fig. 3
Download original image
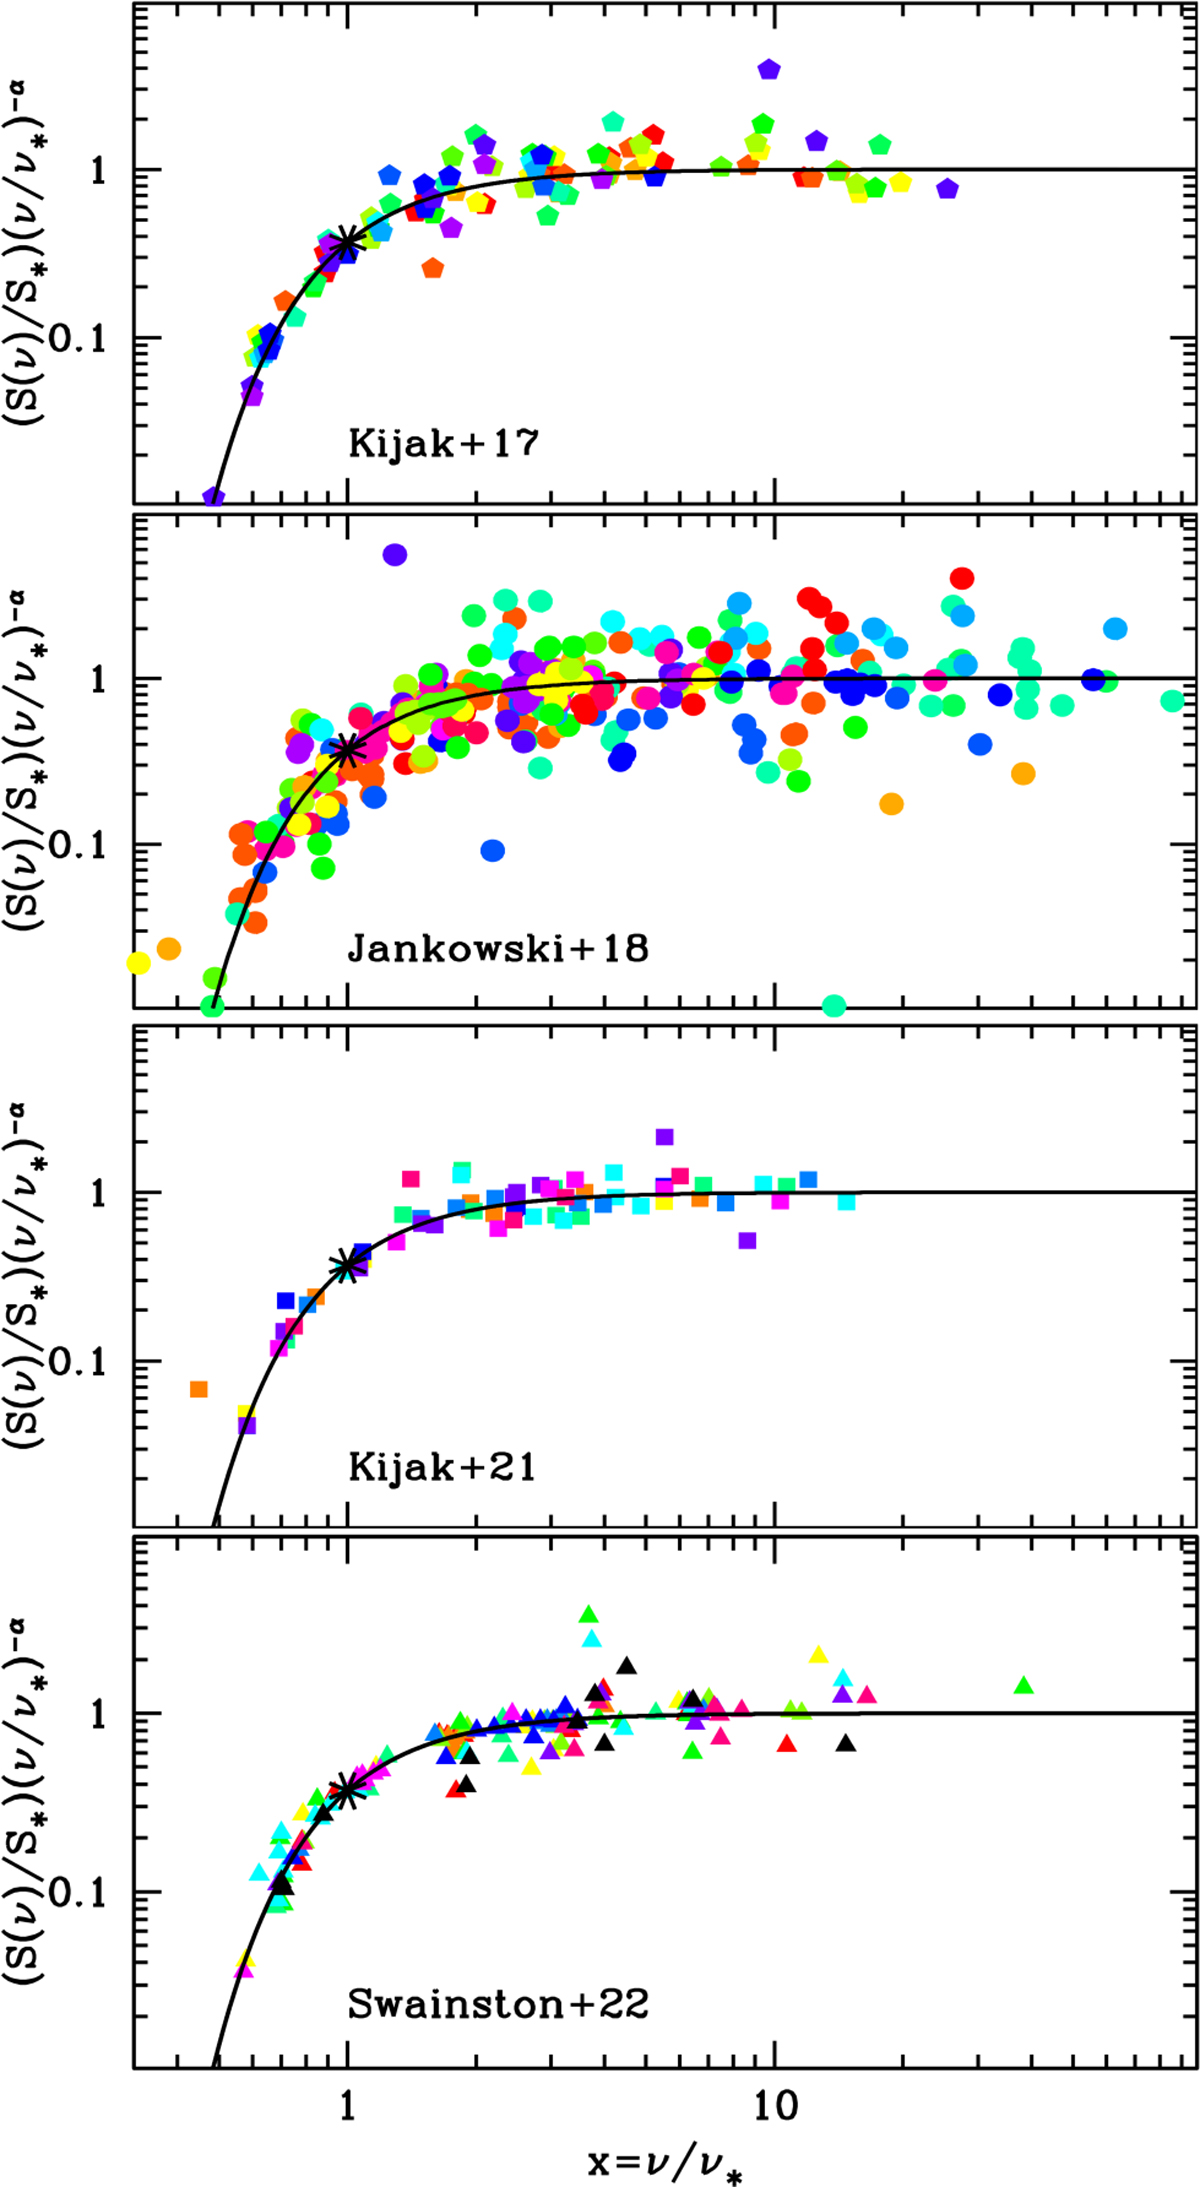
Radio flux density, normalised by the characteristic flux and power-law emission, plotted against normalised frequency for the four subsamples in our study (see labels). Each spectrum was fitted by the respective authors with an exponential drop-off with an exponent −2.1. The curved solid line represents the normalised absorption function A(x) = exp(−x−2.1), and the asterisk indicates the characteristic frequency, ν∗.
Current usage metrics show cumulative count of Article Views (full-text article views including HTML views, PDF and ePub downloads, according to the available data) and Abstracts Views on Vision4Press platform.
Data correspond to usage on the plateform after 2015. The current usage metrics is available 48-96 hours after online publication and is updated daily on week days.
Initial download of the metrics may take a while.