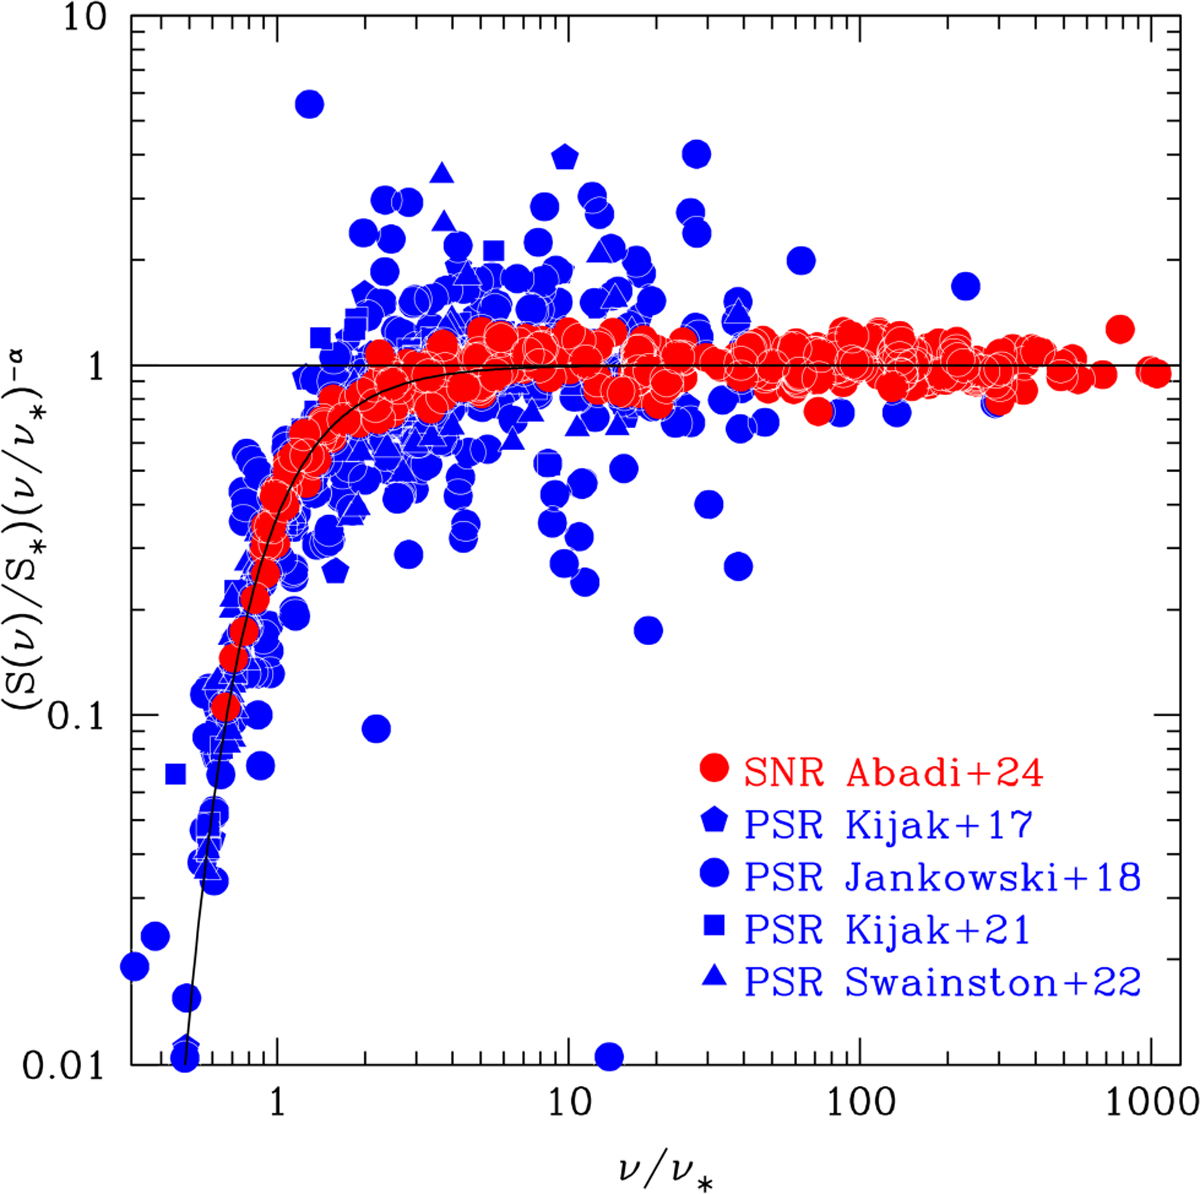
Fig. 4
Download original image
Same PSR data as plotted in Fig. 3 but with the four subsamples merged (blue symbols). Additionally, data points for the SNRs presented in Abadi et al. (2024) are reproduced (red symbols). The graph highlights the similarity not only between the PSR spectra but also between the PSR and SNR spectral behaviours. The curved solid line is the normalised absorption, A(x) = exp(−x−2.1).
Current usage metrics show cumulative count of Article Views (full-text article views including HTML views, PDF and ePub downloads, according to the available data) and Abstracts Views on Vision4Press platform.
Data correspond to usage on the plateform after 2015. The current usage metrics is available 48-96 hours after online publication and is updated daily on week days.
Initial download of the metrics may take a while.