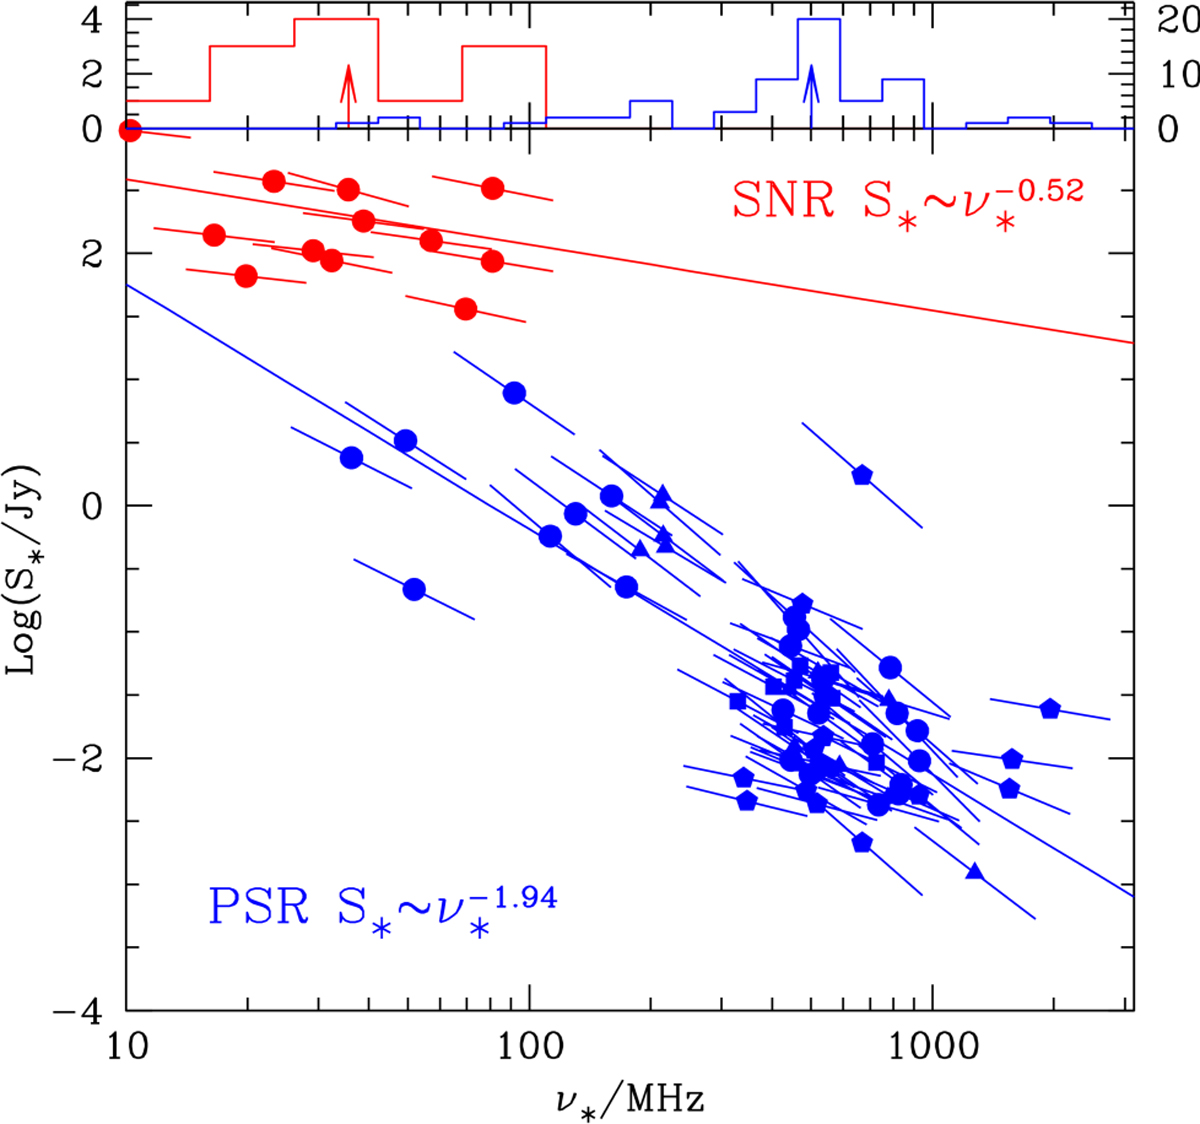
Fig. 5
Download original image
Relation between the characteristic flux, S∗, and frequency, ν*, parameters obtained from fitting the parameterised free-free thermal absorption model (Eq. (4)) for our sample of 63 PSRs. For comparison, parameters calculated from the same model fit applied to 12 SNRs (Abadi et al. 2024) are also included. All data points are shown with the same symbols and colours as in Fig. 4. The long solid lines represent the best-fit linear relations for the PSR (blue) and SNR (red) parameters, with logarithmic slopes of −1.94 and −0.52, respectively. Short lines on each data point indicate the radio spectral index for each object, taken from K17, J18, K21, and S22 for PSRs and from Abadi et al. (2024) for SNRs. The median values of these spectral indices are consistent with the slopes of the power-law correlation between S* and ν*. The distribution of ν∗ values for PSRs and SNRs, with median values indicated by arrows, is shown in the blue and red histograms in the top panel.
Current usage metrics show cumulative count of Article Views (full-text article views including HTML views, PDF and ePub downloads, according to the available data) and Abstracts Views on Vision4Press platform.
Data correspond to usage on the plateform after 2015. The current usage metrics is available 48-96 hours after online publication and is updated daily on week days.
Initial download of the metrics may take a while.