Fig. 6
Download original image
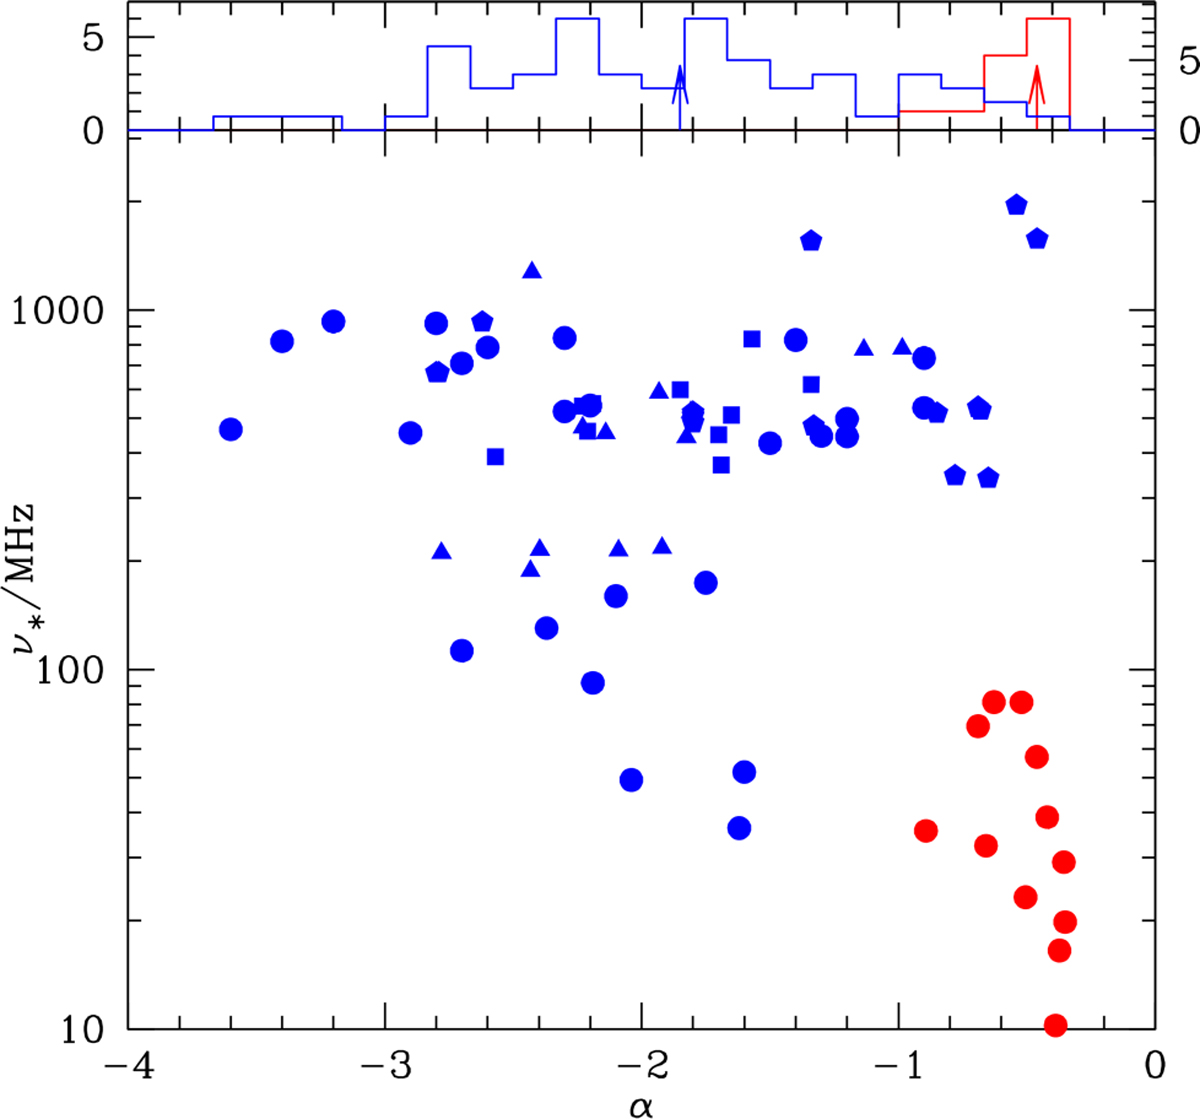
Characteristic frequency, ν∗, fitted parameter in the model with an exponential drop-off of index −2.1 from Eq. (4) vs the spectral index of the radio emission for the PSRs in our sample, as reported in K17, J18, K21, and S22. Data points for PSRs are shown with blue symbols, as in Fig. 4, and data for SNR spectra with exponential turnovers from Abadi et al. (2024) are shown as red circles. No correlation between the plotted parameters is evident. The histograms in the top panel show the distribution of α values for the collection of PSRs (blue) and SNRs (red), with median values marked by arrows.
Current usage metrics show cumulative count of Article Views (full-text article views including HTML views, PDF and ePub downloads, according to the available data) and Abstracts Views on Vision4Press platform.
Data correspond to usage on the plateform after 2015. The current usage metrics is available 48-96 hours after online publication and is updated daily on week days.
Initial download of the metrics may take a while.